Methanosphaera sp. rholeuAM6
Taxonomy: cellular organisms; Archaea; Euryarchaeota; Methanomada group; Methanobacteria; Methanobacteriales; Methanobacteriaceae; Methanosphaera; unclassified Methanosphaera
Average proteome isoelectric point is 5.75
Get precalculated fractions of proteins
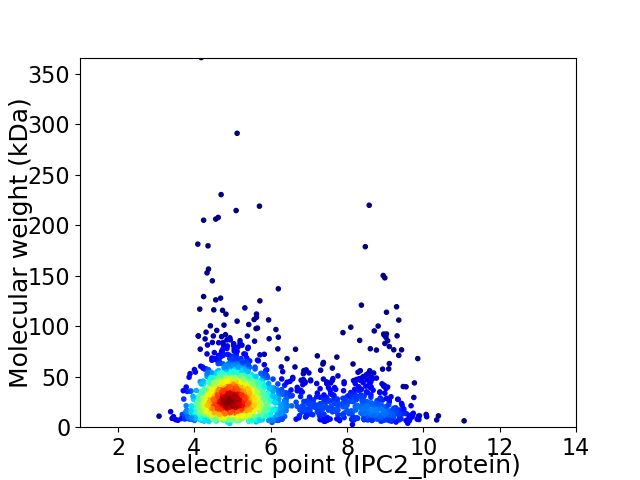
Virtual 2D-PAGE plot for 1750 proteins (isoelectric point calculated using IPC2_protein)
Get csv file with sequences according to given criteria:
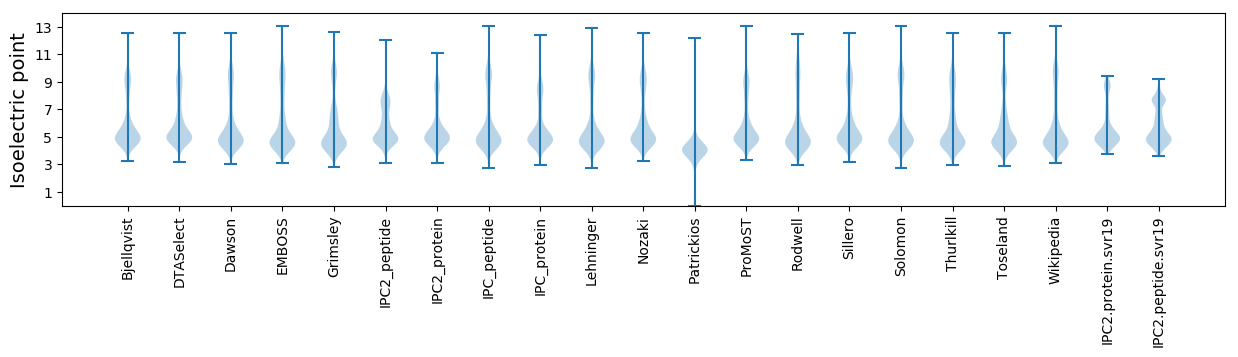
* You can choose from 21 different methods for calculating isoelectric point
Summary statistics related to proteome-wise predictions
Protein with the lowest isoelectric point:
>tr|A0A328RXT7|A0A328RXT7_9EURY Uncharacterized protein (Fragment) OS=Methanosphaera sp. rholeuAM6 OX=1945580 GN=BZ135_08995 PE=4 SV=1
MM1 pKa = 7.63LLLIVFTITITLSSVNAGLFDD22 pKa = 5.68LDD24 pKa = 4.42STNDD28 pKa = 4.2DD29 pKa = 3.57INVTDD34 pKa = 5.19LEE36 pKa = 4.46INYY39 pKa = 9.27EE40 pKa = 4.25GYY42 pKa = 8.12STYY45 pKa = 10.81EE46 pKa = 4.25VNCKK50 pKa = 8.27LTPKK54 pKa = 10.41KK55 pKa = 10.81DD56 pKa = 3.44FDD58 pKa = 4.04YY59 pKa = 11.82LEE61 pKa = 4.36MFVIFYY67 pKa = 10.77DD68 pKa = 3.74SDD70 pKa = 3.96DD71 pKa = 3.83AVLDD75 pKa = 3.63KK76 pKa = 10.95STLVWNTNQPTKK88 pKa = 10.85DD89 pKa = 3.32QVIKK93 pKa = 11.07VSGTAYY99 pKa = 9.78VQNDD103 pKa = 3.11NEE105 pKa = 4.34KK106 pKa = 9.12PVRR109 pKa = 11.84AEE111 pKa = 3.96VYY113 pKa = 8.82FTDD116 pKa = 4.62GLDD119 pKa = 3.97AEE121 pKa = 4.85PEE123 pKa = 4.08SAIYY127 pKa = 10.15SEE129 pKa = 4.28NVTMGG134 pKa = 3.03
MM1 pKa = 7.63LLLIVFTITITLSSVNAGLFDD22 pKa = 5.68LDD24 pKa = 4.42STNDD28 pKa = 4.2DD29 pKa = 3.57INVTDD34 pKa = 5.19LEE36 pKa = 4.46INYY39 pKa = 9.27EE40 pKa = 4.25GYY42 pKa = 8.12STYY45 pKa = 10.81EE46 pKa = 4.25VNCKK50 pKa = 8.27LTPKK54 pKa = 10.41KK55 pKa = 10.81DD56 pKa = 3.44FDD58 pKa = 4.04YY59 pKa = 11.82LEE61 pKa = 4.36MFVIFYY67 pKa = 10.77DD68 pKa = 3.74SDD70 pKa = 3.96DD71 pKa = 3.83AVLDD75 pKa = 3.63KK76 pKa = 10.95STLVWNTNQPTKK88 pKa = 10.85DD89 pKa = 3.32QVIKK93 pKa = 11.07VSGTAYY99 pKa = 9.78VQNDD103 pKa = 3.11NEE105 pKa = 4.34KK106 pKa = 9.12PVRR109 pKa = 11.84AEE111 pKa = 3.96VYY113 pKa = 8.82FTDD116 pKa = 4.62GLDD119 pKa = 3.97AEE121 pKa = 4.85PEE123 pKa = 4.08SAIYY127 pKa = 10.15SEE129 pKa = 4.28NVTMGG134 pKa = 3.03
Molecular weight: 15.11 kDa
Isoelectric point according different methods:
Protein with the highest isoelectric point:
>tr|A0A328RY80|A0A328RY80_9EURY Uncharacterized protein (Fragment) OS=Methanosphaera sp. rholeuAM6 OX=1945580 GN=BZ135_03755 PE=4 SV=1
MM1 pKa = 7.43SRR3 pKa = 11.84NKK5 pKa = 10.09YY6 pKa = 9.7LPKK9 pKa = 10.37KK10 pKa = 10.31LRR12 pKa = 11.84LAKK15 pKa = 10.19KK16 pKa = 8.58NKK18 pKa = 7.27QNRR21 pKa = 11.84RR22 pKa = 11.84VPIFAMMKK30 pKa = 8.74TSRR33 pKa = 11.84KK34 pKa = 9.59LRR36 pKa = 11.84THH38 pKa = 6.39PKK40 pKa = 7.85ARR42 pKa = 11.84QWRR45 pKa = 11.84RR46 pKa = 11.84SKK48 pKa = 10.85IKK50 pKa = 10.31VV51 pKa = 3.11
MM1 pKa = 7.43SRR3 pKa = 11.84NKK5 pKa = 10.09YY6 pKa = 9.7LPKK9 pKa = 10.37KK10 pKa = 10.31LRR12 pKa = 11.84LAKK15 pKa = 10.19KK16 pKa = 8.58NKK18 pKa = 7.27QNRR21 pKa = 11.84RR22 pKa = 11.84VPIFAMMKK30 pKa = 8.74TSRR33 pKa = 11.84KK34 pKa = 9.59LRR36 pKa = 11.84THH38 pKa = 6.39PKK40 pKa = 7.85ARR42 pKa = 11.84QWRR45 pKa = 11.84RR46 pKa = 11.84SKK48 pKa = 10.85IKK50 pKa = 10.31VV51 pKa = 3.11
Molecular weight: 6.3 kDa
Isoelectric point according different methods:
Peptides (in silico digests for buttom-up proteomics)
Below you can find in silico digests of the whole proteome with Trypsin, Chymotrypsin, Trypsin+LysC, LysN, ArgC proteases suitable for different mass spec machines.| Try ESI |
 |
|---|
| ChTry ESI |
|
|---|
| ArgC ESI |
|
|---|
| LysN ESI |
|
|---|
| TryLysC ESI |
|
|---|
| Try MALDI |
|
|---|
| ChTry MALDI |
|
|---|
| ArgC MALDI |
|
|---|
| LysN MALDI |
|
|---|
| TryLysC MALDI |
|
|---|
| Try LTQ |
|
|---|
| ChTry LTQ |
|
|---|
| ArgC LTQ |
|
|---|
| LysN LTQ |
|
|---|
| TryLysC LTQ |
|
|---|
| Try MSlow |
|
|---|
| ChTry MSlow |
|
|---|
| ArgC MSlow |
|
|---|
| LysN MSlow |
|
|---|
| TryLysC MSlow |
|
|---|
| Try MShigh |
|
|---|
| ChTry MShigh |
|
|---|
| ArgC MShigh |
|
|---|
| LysN MShigh |
|
|---|
| TryLysC MShigh |
|
|---|
General Statistics
Number of major isoforms |
Number of additional isoforms |
Number of all proteins |
Number of amino acids |
Min. Seq. Length |
Max. Seq. Length |
Avg. Seq. Length |
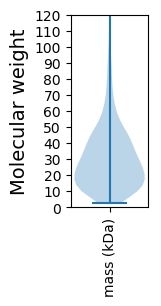
Avg. Mol. Weight |
|---|---|---|---|---|---|---|---|
0 |
513664 |
25 |
3340 |
293.5 |
33.05 |
Amino acid frequency
Ala |
Cys |
Asp |
Glu |
Phe |
Gly |
His |
Ile |
Lys |
Leu |
|---|---|---|---|---|---|---|---|---|---|
5.383 ± 0.072 | 1.156 ± 0.026 |
6.311 ± 0.051 | 7.302 ± 0.092 |
3.797 ± 0.045 | 5.96 ± 0.072 |
1.653 ± 0.028 | 9.491 ± 0.067 |
7.65 ± 0.085 | 8.484 ± 0.078 |
Met |
Asn |
Gln |
Pro |
Arg |
Ser |
Thr |
Val |
Trp |
Tyr |
|---|---|---|---|---|---|---|---|---|---|
2.325 ± 0.033 | 6.989 ± 0.115 |
3.033 ± 0.036 | 2.698 ± 0.041 |
3.199 ± 0.046 | 6.293 ± 0.058 |
6.6 ± 0.125 | 6.704 ± 0.067 |
0.583 ± 0.018 | 4.371 ± 0.059 |
Most of the basic statistics you can see at this page can be downloaded from this CSV file
See this proteome in:

Proteome-pI is available under Creative Commons Attribution-NoDerivs license, for more details see here
| Reference: Kozlowski LP. Proteome-pI 2.0: Proteome Isoelectric Point Database Update. Nucleic Acids Res. 2021, doi: 10.1093/nar/gkab944 | Contact: Lukasz P. Kozlowski |