Sporobolus striate mosaic virus 2
Taxonomy: Viruses; Monodnaviria; Shotokuvirae; Cressdnaviricota; Repensiviricetes; Geplafuvirales; Geminiviridae; Mastrevirus
Average proteome isoelectric point is 8.26
Get precalculated fractions of proteins

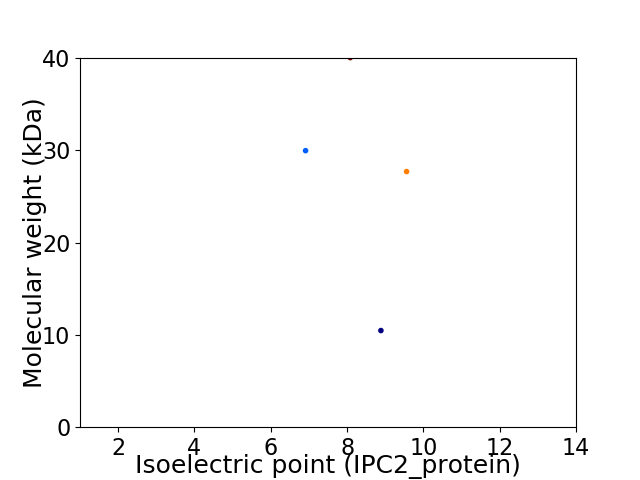
Virtual 2D-PAGE plot for 4 proteins (isoelectric point calculated using IPC2_protein)
Get csv file with sequences according to given criteria:
* You can choose from 21 different methods for calculating isoelectric point
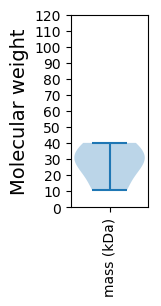
Summary statistics related to proteome-wise predictions


Protein with the lowest isoelectric point:
>tr|J7FHN2|J7FHN2_9GEMI Capsid protein OS=Sporobolus striate mosaic virus 2 OX=1302850 PE=3 SV=1
MM1 pKa = 7.66SSQSNSTEE9 pKa = 3.45ASPANFRR16 pKa = 11.84FRR18 pKa = 11.84ARR20 pKa = 11.84SAFLTYY26 pKa = 9.35PKK28 pKa = 9.65CTLEE32 pKa = 4.02PRR34 pKa = 11.84DD35 pKa = 4.05VVEE38 pKa = 4.08HH39 pKa = 6.71LYY41 pKa = 11.21SKK43 pKa = 10.1FRR45 pKa = 11.84KK46 pKa = 9.61YY47 pKa = 10.39GPKK50 pKa = 8.48YY51 pKa = 9.44CLVTRR56 pKa = 11.84EE57 pKa = 4.04HH58 pKa = 6.9HH59 pKa = 7.16SDD61 pKa = 3.16GDD63 pKa = 3.87YY64 pKa = 11.08HH65 pKa = 6.47LHH67 pKa = 7.29CLFQLDD73 pKa = 4.43KK74 pKa = 11.4AFSTNDD80 pKa = 2.79SSTFNILDD88 pKa = 3.54YY89 pKa = 11.01HH90 pKa = 6.63PNIQTAKK97 pKa = 10.19SPTNVRR103 pKa = 11.84DD104 pKa = 3.61YY105 pKa = 11.11CLKK108 pKa = 10.68NPVSKK113 pKa = 11.01AEE115 pKa = 4.09RR116 pKa = 11.84GTFIPLKK123 pKa = 10.62GRR125 pKa = 11.84TPKK128 pKa = 9.28NTEE131 pKa = 3.78SKK133 pKa = 11.03AKK135 pKa = 10.03DD136 pKa = 3.24SVMRR140 pKa = 11.84SIINTSTDD148 pKa = 3.14RR149 pKa = 11.84ASYY152 pKa = 11.0LSMVRR157 pKa = 11.84KK158 pKa = 9.91AFPFDD163 pKa = 3.26WATKK167 pKa = 8.85LQQFEE172 pKa = 4.39YY173 pKa = 10.11SASKK177 pKa = 10.47LFPDD181 pKa = 4.99VIPEE185 pKa = 4.06YY186 pKa = 9.9TSPFPTEE193 pKa = 4.11NLMCNEE199 pKa = 5.62RR200 pKa = 11.84ITDD203 pKa = 3.49WLDD206 pKa = 2.99NTLYY210 pKa = 10.34QVSPAAYY217 pKa = 10.01SSLHH221 pKa = 5.59PQADD225 pKa = 3.27ASGDD229 pKa = 4.14LNWLMDD235 pKa = 4.08ASLQTIQEE243 pKa = 4.25LGNLGSTSADD253 pKa = 3.04QIVPVRR259 pKa = 11.84HH260 pKa = 6.52LGPGVV265 pKa = 3.14
MM1 pKa = 7.66SSQSNSTEE9 pKa = 3.45ASPANFRR16 pKa = 11.84FRR18 pKa = 11.84ARR20 pKa = 11.84SAFLTYY26 pKa = 9.35PKK28 pKa = 9.65CTLEE32 pKa = 4.02PRR34 pKa = 11.84DD35 pKa = 4.05VVEE38 pKa = 4.08HH39 pKa = 6.71LYY41 pKa = 11.21SKK43 pKa = 10.1FRR45 pKa = 11.84KK46 pKa = 9.61YY47 pKa = 10.39GPKK50 pKa = 8.48YY51 pKa = 9.44CLVTRR56 pKa = 11.84EE57 pKa = 4.04HH58 pKa = 6.9HH59 pKa = 7.16SDD61 pKa = 3.16GDD63 pKa = 3.87YY64 pKa = 11.08HH65 pKa = 6.47LHH67 pKa = 7.29CLFQLDD73 pKa = 4.43KK74 pKa = 11.4AFSTNDD80 pKa = 2.79SSTFNILDD88 pKa = 3.54YY89 pKa = 11.01HH90 pKa = 6.63PNIQTAKK97 pKa = 10.19SPTNVRR103 pKa = 11.84DD104 pKa = 3.61YY105 pKa = 11.11CLKK108 pKa = 10.68NPVSKK113 pKa = 11.01AEE115 pKa = 4.09RR116 pKa = 11.84GTFIPLKK123 pKa = 10.62GRR125 pKa = 11.84TPKK128 pKa = 9.28NTEE131 pKa = 3.78SKK133 pKa = 11.03AKK135 pKa = 10.03DD136 pKa = 3.24SVMRR140 pKa = 11.84SIINTSTDD148 pKa = 3.14RR149 pKa = 11.84ASYY152 pKa = 11.0LSMVRR157 pKa = 11.84KK158 pKa = 9.91AFPFDD163 pKa = 3.26WATKK167 pKa = 8.85LQQFEE172 pKa = 4.39YY173 pKa = 10.11SASKK177 pKa = 10.47LFPDD181 pKa = 4.99VIPEE185 pKa = 4.06YY186 pKa = 9.9TSPFPTEE193 pKa = 4.11NLMCNEE199 pKa = 5.62RR200 pKa = 11.84ITDD203 pKa = 3.49WLDD206 pKa = 2.99NTLYY210 pKa = 10.34QVSPAAYY217 pKa = 10.01SSLHH221 pKa = 5.59PQADD225 pKa = 3.27ASGDD229 pKa = 4.14LNWLMDD235 pKa = 4.08ASLQTIQEE243 pKa = 4.25LGNLGSTSADD253 pKa = 3.04QIVPVRR259 pKa = 11.84HH260 pKa = 6.52LGPGVV265 pKa = 3.14
Molecular weight: 29.98 kDa
Isoelectric point according different methods:
Protein with the highest isoelectric point:
>tr|J7FGY7|J7FGY7_9GEMI Replication-associated protein OS=Sporobolus striate mosaic virus 2 OX=1302850 PE=3 SV=1
MM1 pKa = 7.59SNPATPLGDD10 pKa = 3.68YY11 pKa = 9.15TSSQHH16 pKa = 6.31QGGTQSGSVGIGNDD30 pKa = 3.66SAWRR34 pKa = 11.84ALALAFTVTTVTLVLLFGAWRR55 pKa = 11.84LCLKK59 pKa = 10.71DD60 pKa = 3.77CLLTLRR66 pKa = 11.84AKK68 pKa = 10.38RR69 pKa = 11.84SKK71 pKa = 7.92TTTEE75 pKa = 4.0LGFGQTPRR83 pKa = 11.84RR84 pKa = 11.84DD85 pKa = 3.57PVGGGVTQYY94 pKa = 11.04PPGVPGG100 pKa = 3.64
MM1 pKa = 7.59SNPATPLGDD10 pKa = 3.68YY11 pKa = 9.15TSSQHH16 pKa = 6.31QGGTQSGSVGIGNDD30 pKa = 3.66SAWRR34 pKa = 11.84ALALAFTVTTVTLVLLFGAWRR55 pKa = 11.84LCLKK59 pKa = 10.71DD60 pKa = 3.77CLLTLRR66 pKa = 11.84AKK68 pKa = 10.38RR69 pKa = 11.84SKK71 pKa = 7.92TTTEE75 pKa = 4.0LGFGQTPRR83 pKa = 11.84RR84 pKa = 11.84DD85 pKa = 3.57PVGGGVTQYY94 pKa = 11.04PPGVPGG100 pKa = 3.64
Molecular weight: 10.48 kDa
Isoelectric point according different methods:
Peptides (in silico digests for buttom-up proteomics)
Below you can find in silico digests of the whole proteome with Trypsin, Chymotrypsin, Trypsin+LysC, LysN, ArgC proteases suitable for different mass spec machines.| Try ESI |
 |
|---|
| ChTry ESI |
 |
|---|
| ArgC ESI |
 |
|---|
| LysN ESI |
 |
|---|
| TryLysC ESI |
 |
|---|
| Try MALDI |
 |
|---|
| ChTry MALDI |
 |
|---|
| ArgC MALDI |
 |
|---|
| LysN MALDI |
 |
|---|
| TryLysC MALDI |
 |
|---|
| Try LTQ |
 |
|---|
| ChTry LTQ |
 |
|---|
| ArgC LTQ |
 |
|---|
| LysN LTQ |
 |
|---|
| TryLysC LTQ |
 |
|---|
| Try MSlow |
 |
|---|
| ChTry MSlow |
 |
|---|
| ArgC MSlow |
 |
|---|
| LysN MSlow |
 |
|---|
| TryLysC MSlow |
 |
|---|
| Try MShigh |
 |
|---|
| ChTry MShigh |
 |
|---|
| ArgC MShigh |
 |
|---|
| LysN MShigh |
 |
|---|
| TryLysC MShigh |
 |
|---|
General Statistics
Number of major isoforms |
Number of additional isoforms |
Number of all proteins |
Number of amino acids |
Min. Seq. Length |
Max. Seq. Length |
Avg. Seq. Length |
Avg. Mol. Weight |
|---|---|---|---|---|---|---|---|
0 |
957 |
100 |
346 |
239.3 |
27.06 |
Amino acid frequency
Ala |
Cys |
Asp |
Glu |
Phe |
Gly |
His |
Ile |
Lys |
Leu |
|---|---|---|---|---|---|---|---|---|---|
5.956 ± 0.37 | 1.881 ± 0.084 |
5.747 ± 0.375 | 3.657 ± 0.655 |
4.598 ± 0.346 | 6.688 ± 1.992 |
2.299 ± 0.366 | 3.866 ± 0.518 |
5.852 ± 0.594 | 7.315 ± 1.065 |
Met |
Asn |
Gln |
Pro |
Arg |
Ser |
Thr |
Val |
Trp |
Tyr |
|---|---|---|---|---|---|---|---|---|---|
1.985 ± 0.248 | 5.225 ± 0.754 |
6.165 ± 0.28 | 3.239 ± 0.388 |
6.688 ± 1.005 | 8.986 ± 0.832 |
7.837 ± 0.884 | 5.12 ± 0.848 |
1.776 ± 0.275 | 5.12 ± 0.577 |
Most of the basic statistics you can see at this page can be downloaded from this CSV file
Proteome-pI is available under Creative Commons Attribution-NoDerivs license, for more details see here
| Reference: Kozlowski LP. Proteome-pI 2.0: Proteome Isoelectric Point Database Update. Nucleic Acids Res. 2021, doi: 10.1093/nar/gkab944 | Contact: Lukasz P. Kozlowski |
