Marinifilaceae bacterium T3-2 S1-C
Taxonomy: cellular organisms; Bacteria; FCB group; Bacteroidetes/Chlorobi group; Bacteroidetes; Bacteroidia; Marinilabiliales; Marinifilaceae; Ancylomarina
Average proteome isoelectric point is 6.77
Get precalculated fractions of proteins

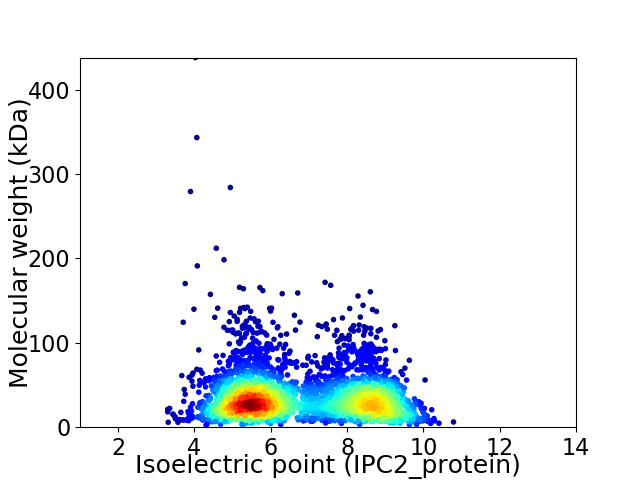
Virtual 2D-PAGE plot for 3389 proteins (isoelectric point calculated using IPC2_protein)
Get csv file with sequences according to given criteria:
* You can choose from 21 different methods for calculating isoelectric point
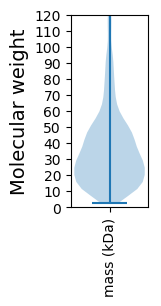
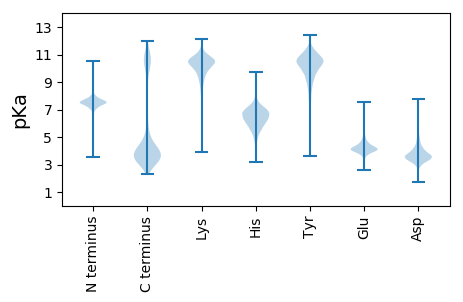
Summary statistics related to proteome-wise predictions


Protein with the lowest isoelectric point:
>tr|A0A434ATP8|A0A434ATP8_9BACT DUF4199 domain-containing protein OS=Marinifilaceae bacterium T3-2 S1-C OX=2487017 GN=DLK05_11420 PE=4 SV=1
MM1 pKa = 7.6KK2 pKa = 10.22KK3 pKa = 10.3YY4 pKa = 10.85LLLGYY9 pKa = 10.1LLVISTLIVYY19 pKa = 8.81SQTPPTLNAATGATVDD35 pKa = 3.67GNIVITFSDD44 pKa = 3.61PGSYY48 pKa = 8.28RR49 pKa = 11.84TSIQSVSYY57 pKa = 10.68NNTVLPSGALDD68 pKa = 3.57LTVTDD73 pKa = 4.5QIILIPSGDD82 pKa = 3.74PALQVAGSADD92 pKa = 3.99VIVVATGFSDD102 pKa = 3.38ATVSQTIGHH111 pKa = 6.61GAANKK116 pKa = 10.37LGVTTQPVAPSVNGGVFATQPAITVQDD143 pKa = 3.68QYY145 pKa = 12.13GNTCTSDD152 pKa = 3.31GPRR155 pKa = 11.84SITAANGDD163 pKa = 3.95GQSWTLGGTTDD174 pKa = 3.3QDD176 pKa = 3.38ASSGVLTFSGLTATSNVAVSNAYY199 pKa = 8.72LTFSTSGLTSINSNTFSLALNSPPAITASGTATVDD234 pKa = 2.99ADD236 pKa = 3.67FTITFADD243 pKa = 3.49ANGWQSKK250 pKa = 7.37ITSITYY256 pKa = 10.09GGTDD260 pKa = 2.55ISGAYY265 pKa = 7.48NTGGTSGEE273 pKa = 4.05ITFTPSASTALQAAGTADD291 pKa = 3.67FVIVATGFSDD301 pKa = 3.38ATVSQTIGHH310 pKa = 7.0GSPTKK315 pKa = 10.64LGVTTQPVAPSVNGAAFAPQPAIAIQDD342 pKa = 3.56QYY344 pKa = 12.16DD345 pKa = 3.93NVCTTDD351 pKa = 3.09GTRR354 pKa = 11.84TITAAKK360 pKa = 9.8ADD362 pKa = 3.81AGNWTLGGTTDD373 pKa = 3.3QDD375 pKa = 3.38ASSGVLTFSGLTATSS390 pKa = 3.25
MM1 pKa = 7.6KK2 pKa = 10.22KK3 pKa = 10.3YY4 pKa = 10.85LLLGYY9 pKa = 10.1LLVISTLIVYY19 pKa = 8.81SQTPPTLNAATGATVDD35 pKa = 3.67GNIVITFSDD44 pKa = 3.61PGSYY48 pKa = 8.28RR49 pKa = 11.84TSIQSVSYY57 pKa = 10.68NNTVLPSGALDD68 pKa = 3.57LTVTDD73 pKa = 4.5QIILIPSGDD82 pKa = 3.74PALQVAGSADD92 pKa = 3.99VIVVATGFSDD102 pKa = 3.38ATVSQTIGHH111 pKa = 6.61GAANKK116 pKa = 10.37LGVTTQPVAPSVNGGVFATQPAITVQDD143 pKa = 3.68QYY145 pKa = 12.13GNTCTSDD152 pKa = 3.31GPRR155 pKa = 11.84SITAANGDD163 pKa = 3.95GQSWTLGGTTDD174 pKa = 3.3QDD176 pKa = 3.38ASSGVLTFSGLTATSNVAVSNAYY199 pKa = 8.72LTFSTSGLTSINSNTFSLALNSPPAITASGTATVDD234 pKa = 2.99ADD236 pKa = 3.67FTITFADD243 pKa = 3.49ANGWQSKK250 pKa = 7.37ITSITYY256 pKa = 10.09GGTDD260 pKa = 2.55ISGAYY265 pKa = 7.48NTGGTSGEE273 pKa = 4.05ITFTPSASTALQAAGTADD291 pKa = 3.67FVIVATGFSDD301 pKa = 3.38ATVSQTIGHH310 pKa = 7.0GSPTKK315 pKa = 10.64LGVTTQPVAPSVNGAAFAPQPAIAIQDD342 pKa = 3.56QYY344 pKa = 12.16DD345 pKa = 3.93NVCTTDD351 pKa = 3.09GTRR354 pKa = 11.84TITAAKK360 pKa = 9.8ADD362 pKa = 3.81AGNWTLGGTTDD373 pKa = 3.3QDD375 pKa = 3.38ASSGVLTFSGLTATSS390 pKa = 3.25
Molecular weight: 39.08 kDa
Isoelectric point according different methods:
Protein with the highest isoelectric point:
>tr|A0A434AVJ3|A0A434AVJ3_9BACT Thymidine kinase OS=Marinifilaceae bacterium T3-2 S1-C OX=2487017 GN=tdk PE=3 SV=1
MM1 pKa = 7.45KK2 pKa = 9.61RR3 pKa = 11.84TFQPSNRR10 pKa = 11.84KK11 pKa = 8.89RR12 pKa = 11.84RR13 pKa = 11.84NKK15 pKa = 9.89HH16 pKa = 3.93GFRR19 pKa = 11.84EE20 pKa = 4.17RR21 pKa = 11.84MASVSGRR28 pKa = 11.84AVLSRR33 pKa = 11.84RR34 pKa = 11.84RR35 pKa = 11.84AKK37 pKa = 10.14GRR39 pKa = 11.84KK40 pKa = 7.97KK41 pKa = 10.62LSVSSEE47 pKa = 3.87RR48 pKa = 11.84RR49 pKa = 11.84HH50 pKa = 5.76KK51 pKa = 10.9AA52 pKa = 2.86
MM1 pKa = 7.45KK2 pKa = 9.61RR3 pKa = 11.84TFQPSNRR10 pKa = 11.84KK11 pKa = 8.89RR12 pKa = 11.84RR13 pKa = 11.84NKK15 pKa = 9.89HH16 pKa = 3.93GFRR19 pKa = 11.84EE20 pKa = 4.17RR21 pKa = 11.84MASVSGRR28 pKa = 11.84AVLSRR33 pKa = 11.84RR34 pKa = 11.84RR35 pKa = 11.84AKK37 pKa = 10.14GRR39 pKa = 11.84KK40 pKa = 7.97KK41 pKa = 10.62LSVSSEE47 pKa = 3.87RR48 pKa = 11.84RR49 pKa = 11.84HH50 pKa = 5.76KK51 pKa = 10.9AA52 pKa = 2.86
Molecular weight: 6.18 kDa
Isoelectric point according different methods:
Peptides (in silico digests for buttom-up proteomics)
Below you can find in silico digests of the whole proteome with Trypsin, Chymotrypsin, Trypsin+LysC, LysN, ArgC proteases suitable for different mass spec machines.| Try ESI |
 |
|---|
| ChTry ESI |
 |
|---|
| ArgC ESI |
 |
|---|
| LysN ESI |
 |
|---|
| TryLysC ESI |
 |
|---|
| Try MALDI |
 |
|---|
| ChTry MALDI |
 |
|---|
| ArgC MALDI |
 |
|---|
| LysN MALDI |
 |
|---|
| TryLysC MALDI |
 |
|---|
| Try LTQ |
 |
|---|
| ChTry LTQ |
 |
|---|
| ArgC LTQ |
 |
|---|
| LysN LTQ |
 |
|---|
| TryLysC LTQ |
 |
|---|
| Try MSlow |
 |
|---|
| ChTry MSlow |
 |
|---|
| ArgC MSlow |
 |
|---|
| LysN MSlow |
 |
|---|
| TryLysC MSlow |
 |
|---|
| Try MShigh |
 |
|---|
| ChTry MShigh |
 |
|---|
| ArgC MShigh |
 |
|---|
| LysN MShigh |
 |
|---|
| TryLysC MShigh |
 |
|---|
General Statistics
Number of major isoforms |
Number of additional isoforms |
Number of all proteins |
Number of amino acids |
Min. Seq. Length |
Max. Seq. Length |
Avg. Seq. Length |
Avg. Mol. Weight |
|---|---|---|---|---|---|---|---|
0 |
1141565 |
22 |
4052 |
336.8 |
38.13 |
Amino acid frequency
Ala |
Cys |
Asp |
Glu |
Phe |
Gly |
His |
Ile |
Lys |
Leu |
|---|---|---|---|---|---|---|---|---|---|
6.234 ± 0.042 | 0.979 ± 0.016 |
5.45 ± 0.034 | 6.542 ± 0.045 |
5.118 ± 0.037 | 6.345 ± 0.04 |
1.844 ± 0.017 | 8.274 ± 0.044 |
7.933 ± 0.051 | 9.592 ± 0.046 |
Met |
Asn |
Gln |
Pro |
Arg |
Ser |
Thr |
Val |
Trp |
Tyr |
|---|---|---|---|---|---|---|---|---|---|
2.414 ± 0.021 | 5.872 ± 0.036 |
3.314 ± 0.02 | 3.567 ± 0.022 |
3.837 ± 0.027 | 6.639 ± 0.038 |
4.923 ± 0.036 | 5.977 ± 0.037 |
1.06 ± 0.017 | 4.054 ± 0.029 |
Most of the basic statistics you can see at this page can be downloaded from this CSV file
Proteome-pI is available under Creative Commons Attribution-NoDerivs license, for more details see here
| Reference: Kozlowski LP. Proteome-pI 2.0: Proteome Isoelectric Point Database Update. Nucleic Acids Res. 2021, doi: 10.1093/nar/gkab944 | Contact: Lukasz P. Kozlowski |
