Gordonia sp. NB4-1Y
Taxonomy: cellular organisms; Bacteria; Terrabacteria group; Actinobacteria; Actinomycetia; Corynebacteriales; Gordoniaceae; Gordonia; unclassified Gordonia
Average proteome isoelectric point is 5.88
Get precalculated fractions of proteins

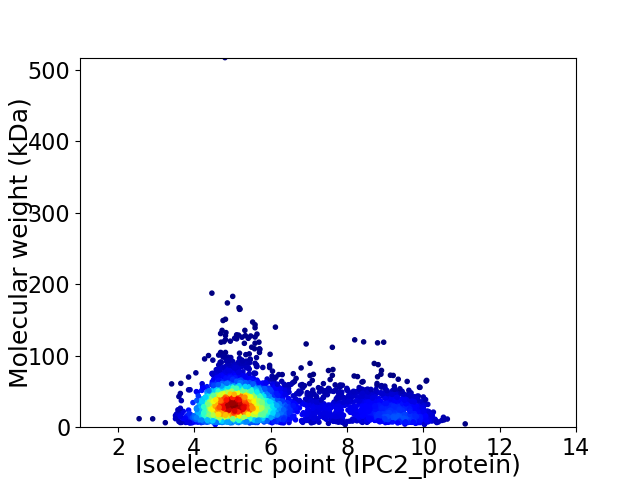
Virtual 2D-PAGE plot for 4263 proteins (isoelectric point calculated using IPC2_protein)
Get csv file with sequences according to given criteria:
* You can choose from 21 different methods for calculating isoelectric point
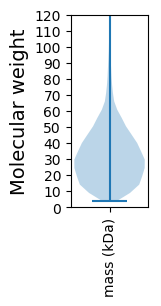
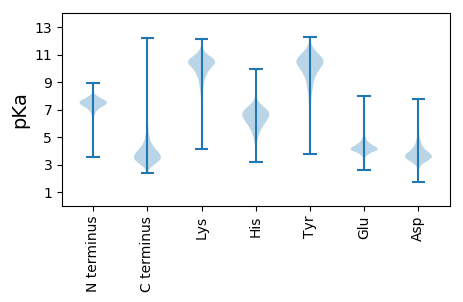
Summary statistics related to proteome-wise predictions


Protein with the lowest isoelectric point:
>tr|A0A0N0UMM5|A0A0N0UMM5_9ACTN Uncharacterized protein OS=Gordonia sp. NB4-1Y OX=1241906 GN=ISGA_11360 PE=4 SV=1
MM1 pKa = 7.17TNQWTGGQQTAGIDD15 pKa = 3.58SSTTTSASGTGSVAVGGDD33 pKa = 3.2ASGPIATTGGVAGDD47 pKa = 4.0GNSVGNSYY55 pKa = 10.84DD56 pKa = 3.88DD57 pKa = 3.47HH58 pKa = 6.31STWVDD63 pKa = 3.42QSVHH67 pKa = 5.81GNNSGNTQNTHH78 pKa = 6.92IEE80 pKa = 4.26DD81 pKa = 3.51NSTNDD86 pKa = 2.77SHH88 pKa = 6.87NQLNVHH94 pKa = 6.78AGGGDD99 pKa = 3.5GGDD102 pKa = 3.88GGDD105 pKa = 3.42GGGWGFGGAGDD116 pKa = 4.41GGDD119 pKa = 3.33GGGNVDD125 pKa = 5.4LSGIDD130 pKa = 3.2LGYY133 pKa = 9.05TRR135 pKa = 11.84GGITSDD141 pKa = 3.12NSNHH145 pKa = 4.6YY146 pKa = 9.53TEE148 pKa = 4.76THH150 pKa = 6.89DD151 pKa = 3.88SHH153 pKa = 7.66DD154 pKa = 3.77ISDD157 pKa = 3.85SFNDD161 pKa = 3.1EE162 pKa = 3.86RR163 pKa = 11.84SYY165 pKa = 11.73DD166 pKa = 3.66SHH168 pKa = 8.4DD169 pKa = 4.44DD170 pKa = 3.42NSTNDD175 pKa = 3.31SFNDD179 pKa = 3.58NSQHH183 pKa = 4.51THH185 pKa = 5.7SEE187 pKa = 4.19SGFDD191 pKa = 4.28PGDD194 pKa = 3.6LLGGVADD201 pKa = 4.15AAGGVAGAYY210 pKa = 10.2GDD212 pKa = 3.82VAGGIAGGIAGGVADD227 pKa = 4.67AAGGIADD234 pKa = 3.84VAGDD238 pKa = 3.81AVDD241 pKa = 5.21AIGDD245 pKa = 3.78ALGDD249 pKa = 3.59IFF251 pKa = 5.98
MM1 pKa = 7.17TNQWTGGQQTAGIDD15 pKa = 3.58SSTTTSASGTGSVAVGGDD33 pKa = 3.2ASGPIATTGGVAGDD47 pKa = 4.0GNSVGNSYY55 pKa = 10.84DD56 pKa = 3.88DD57 pKa = 3.47HH58 pKa = 6.31STWVDD63 pKa = 3.42QSVHH67 pKa = 5.81GNNSGNTQNTHH78 pKa = 6.92IEE80 pKa = 4.26DD81 pKa = 3.51NSTNDD86 pKa = 2.77SHH88 pKa = 6.87NQLNVHH94 pKa = 6.78AGGGDD99 pKa = 3.5GGDD102 pKa = 3.88GGDD105 pKa = 3.42GGGWGFGGAGDD116 pKa = 4.41GGDD119 pKa = 3.33GGGNVDD125 pKa = 5.4LSGIDD130 pKa = 3.2LGYY133 pKa = 9.05TRR135 pKa = 11.84GGITSDD141 pKa = 3.12NSNHH145 pKa = 4.6YY146 pKa = 9.53TEE148 pKa = 4.76THH150 pKa = 6.89DD151 pKa = 3.88SHH153 pKa = 7.66DD154 pKa = 3.77ISDD157 pKa = 3.85SFNDD161 pKa = 3.1EE162 pKa = 3.86RR163 pKa = 11.84SYY165 pKa = 11.73DD166 pKa = 3.66SHH168 pKa = 8.4DD169 pKa = 4.44DD170 pKa = 3.42NSTNDD175 pKa = 3.31SFNDD179 pKa = 3.58NSQHH183 pKa = 4.51THH185 pKa = 5.7SEE187 pKa = 4.19SGFDD191 pKa = 4.28PGDD194 pKa = 3.6LLGGVADD201 pKa = 4.15AAGGVAGAYY210 pKa = 10.2GDD212 pKa = 3.82VAGGIAGGIAGGVADD227 pKa = 4.67AAGGIADD234 pKa = 3.84VAGDD238 pKa = 3.81AVDD241 pKa = 5.21AIGDD245 pKa = 3.78ALGDD249 pKa = 3.59IFF251 pKa = 5.98
Molecular weight: 24.34 kDa
Isoelectric point according different methods:
Protein with the highest isoelectric point:
>tr|M7A5B1|M7A5B1_9ACTN Oxidoreductase OS=Gordonia sp. NB4-1Y OX=1241906 GN=ISGA_4823 PE=4 SV=2
MM1 pKa = 7.59KK2 pKa = 10.19VRR4 pKa = 11.84SSLRR8 pKa = 11.84SLKK11 pKa = 9.98KK12 pKa = 9.94QPGSQVVRR20 pKa = 11.84RR21 pKa = 11.84RR22 pKa = 11.84GRR24 pKa = 11.84VFVINKK30 pKa = 8.12GNPRR34 pKa = 11.84FKK36 pKa = 10.78ARR38 pKa = 11.84QGG40 pKa = 3.28
MM1 pKa = 7.59KK2 pKa = 10.19VRR4 pKa = 11.84SSLRR8 pKa = 11.84SLKK11 pKa = 9.98KK12 pKa = 9.94QPGSQVVRR20 pKa = 11.84RR21 pKa = 11.84RR22 pKa = 11.84GRR24 pKa = 11.84VFVINKK30 pKa = 8.12GNPRR34 pKa = 11.84FKK36 pKa = 10.78ARR38 pKa = 11.84QGG40 pKa = 3.28
Molecular weight: 4.62 kDa
Isoelectric point according different methods:
Peptides (in silico digests for buttom-up proteomics)
Below you can find in silico digests of the whole proteome with Trypsin, Chymotrypsin, Trypsin+LysC, LysN, ArgC proteases suitable for different mass spec machines.| Try ESI |
 |
|---|
| ChTry ESI |
 |
|---|
| ArgC ESI |
 |
|---|
| LysN ESI |
 |
|---|
| TryLysC ESI |
 |
|---|
| Try MALDI |
 |
|---|
| ChTry MALDI |
 |
|---|
| ArgC MALDI |
 |
|---|
| LysN MALDI |
 |
|---|
| TryLysC MALDI |
 |
|---|
| Try LTQ |
 |
|---|
| ChTry LTQ |
 |
|---|
| ArgC LTQ |
 |
|---|
| LysN LTQ |
 |
|---|
| TryLysC LTQ |
 |
|---|
| Try MSlow |
 |
|---|
| ChTry MSlow |
 |
|---|
| ArgC MSlow |
 |
|---|
| LysN MSlow |
 |
|---|
| TryLysC MSlow |
 |
|---|
| Try MShigh |
 |
|---|
| ChTry MShigh |
 |
|---|
| ArgC MShigh |
 |
|---|
| LysN MShigh |
 |
|---|
| TryLysC MShigh |
 |
|---|
General Statistics
Number of major isoforms |
Number of additional isoforms |
Number of all proteins |
Number of amino acids |
Min. Seq. Length |
Max. Seq. Length |
Avg. Seq. Length |
Avg. Mol. Weight |
|---|---|---|---|---|---|---|---|
0 |
1343207 |
32 |
4939 |
315.1 |
33.76 |
Amino acid frequency
Ala |
Cys |
Asp |
Glu |
Phe |
Gly |
His |
Ile |
Lys |
Leu |
|---|---|---|---|---|---|---|---|---|---|
12.771 ± 0.05 | 0.752 ± 0.009 |
6.742 ± 0.029 | 5.2 ± 0.035 |
2.991 ± 0.022 | 9.039 ± 0.034 |
2.261 ± 0.017 | 4.633 ± 0.026 |
2.055 ± 0.025 | 9.455 ± 0.035 |
Met |
Asn |
Gln |
Pro |
Arg |
Ser |
Thr |
Val |
Trp |
Tyr |
|---|---|---|---|---|---|---|---|---|---|
2.013 ± 0.015 | 2.06 ± 0.018 |
5.603 ± 0.029 | 2.72 ± 0.018 |
7.265 ± 0.033 | 5.515 ± 0.023 |
6.559 ± 0.026 | 8.878 ± 0.036 |
1.454 ± 0.015 | 2.035 ± 0.018 |
Most of the basic statistics you can see at this page can be downloaded from this CSV file
Proteome-pI is available under Creative Commons Attribution-NoDerivs license, for more details see here
| Reference: Kozlowski LP. Proteome-pI 2.0: Proteome Isoelectric Point Database Update. Nucleic Acids Res. 2021, doi: 10.1093/nar/gkab944 | Contact: Lukasz P. Kozlowski |
