Lysobacter arseniciresistens ZS79
Taxonomy: cellular organisms; Bacteria; Proteobacteria; Gammaproteobacteria; Xanthomonadales; Xanthomonadaceae; Lysobacter; Lysobacter arseniciresistens
Average proteome isoelectric point is 6.33
Get precalculated fractions of proteins

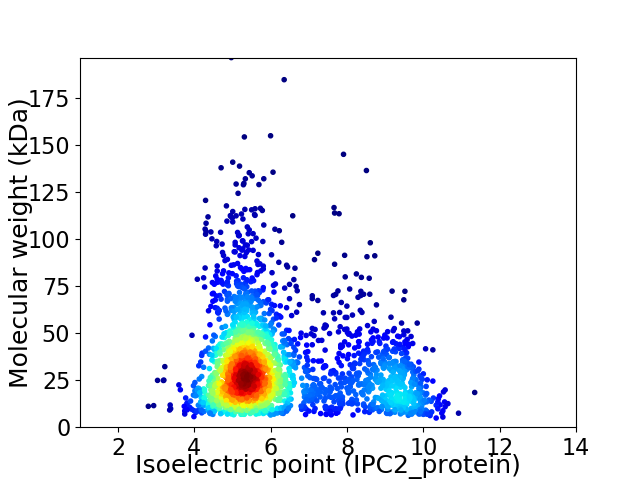
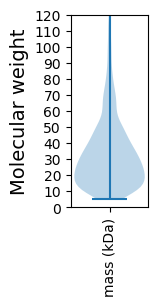
Virtual 2D-PAGE plot for 2363 proteins (isoelectric point calculated using IPC2_protein)
Get csv file with sequences according to given criteria:
* You can choose from 21 different methods for calculating isoelectric point
Summary statistics related to proteome-wise predictions


Protein with the lowest isoelectric point:
>tr|A0A0A0F054|A0A0A0F054_9GAMM Type IV secretion protein Rhs OS=Lysobacter arseniciresistens ZS79 OX=913325 GN=N799_03160 PE=4 SV=1
MM1 pKa = 7.45AASSNTKK8 pKa = 8.62TLLMTLTAALALSACGGGSDD28 pKa = 4.04NVASPGEE35 pKa = 4.41GAFPPPPSSTPPPTTPPPTTPPPTTPPPTAAEE67 pKa = 4.55CPTGTTDD74 pKa = 2.97VGEE77 pKa = 4.39VAGLTNCQLPSRR89 pKa = 11.84IIGEE93 pKa = 4.21LLLPQVDD100 pKa = 3.75GLVYY104 pKa = 10.48SVNGRR109 pKa = 11.84TDD111 pKa = 2.77VGEE114 pKa = 4.42DD115 pKa = 3.28MGGDD119 pKa = 3.58AANPAPQARR128 pKa = 11.84KK129 pKa = 7.67GTLRR133 pKa = 11.84IEE135 pKa = 4.44PGVTVFGSAGADD147 pKa = 2.93FLMVNRR153 pKa = 11.84GSQIFAEE160 pKa = 4.63GDD162 pKa = 3.16AANPIVFTSRR172 pKa = 11.84QSVEE176 pKa = 3.61GTTDD180 pKa = 2.9VDD182 pKa = 6.05SIGQWGGLVLLGRR195 pKa = 11.84AAISTCPGTAQPGTATCEE213 pKa = 4.19AQVEE217 pKa = 4.64GANGYY222 pKa = 10.25YY223 pKa = 10.31GGNANDD229 pKa = 4.87DD230 pKa = 3.58NTGVLKK236 pKa = 9.94YY237 pKa = 10.58VRR239 pKa = 11.84VMHH242 pKa = 6.56SGFEE246 pKa = 3.99VLPDD250 pKa = 3.47VEE252 pKa = 5.22LNGITLAGLGSGTTVEE268 pKa = 4.4YY269 pKa = 10.87VQVHH273 pKa = 5.81NSSDD277 pKa = 4.31DD278 pKa = 3.51GFEE281 pKa = 4.14WFGGTVNAKK290 pKa = 10.1YY291 pKa = 10.52LVGTGNDD298 pKa = 4.0DD299 pKa = 3.62DD300 pKa = 5.28TFDD303 pKa = 3.68TDD305 pKa = 2.65SGYY308 pKa = 10.87RR309 pKa = 11.84GGIQFGLILQRR320 pKa = 11.84AGGGDD325 pKa = 3.26RR326 pKa = 11.84MNEE329 pKa = 3.99MSSQDD334 pKa = 3.32LPYY337 pKa = 10.91RR338 pKa = 11.84SMPNLANVTFVGAGHH353 pKa = 7.4DD354 pKa = 3.63NAIVLNQGTLVGYY367 pKa = 9.73YY368 pKa = 9.89NAVVTGGAPACVEE381 pKa = 4.27FQSDD385 pKa = 3.46TTDD388 pKa = 3.29GVFHH392 pKa = 6.22STYY395 pKa = 10.29LSCDD399 pKa = 3.17VPFAGGASGRR409 pKa = 11.84EE410 pKa = 3.53AAAFNAGTNNATGASTLTGGFINGANEE437 pKa = 3.98AAVPAYY443 pKa = 10.34AGLASVNAAFADD455 pKa = 3.34VDD457 pKa = 4.06YY458 pKa = 11.32IGAVKK463 pKa = 10.53DD464 pKa = 5.27AGDD467 pKa = 3.68TWWQGWTCGLTADD480 pKa = 4.67DD481 pKa = 4.6CC482 pKa = 5.0
MM1 pKa = 7.45AASSNTKK8 pKa = 8.62TLLMTLTAALALSACGGGSDD28 pKa = 4.04NVASPGEE35 pKa = 4.41GAFPPPPSSTPPPTTPPPTTPPPTTPPPTAAEE67 pKa = 4.55CPTGTTDD74 pKa = 2.97VGEE77 pKa = 4.39VAGLTNCQLPSRR89 pKa = 11.84IIGEE93 pKa = 4.21LLLPQVDD100 pKa = 3.75GLVYY104 pKa = 10.48SVNGRR109 pKa = 11.84TDD111 pKa = 2.77VGEE114 pKa = 4.42DD115 pKa = 3.28MGGDD119 pKa = 3.58AANPAPQARR128 pKa = 11.84KK129 pKa = 7.67GTLRR133 pKa = 11.84IEE135 pKa = 4.44PGVTVFGSAGADD147 pKa = 2.93FLMVNRR153 pKa = 11.84GSQIFAEE160 pKa = 4.63GDD162 pKa = 3.16AANPIVFTSRR172 pKa = 11.84QSVEE176 pKa = 3.61GTTDD180 pKa = 2.9VDD182 pKa = 6.05SIGQWGGLVLLGRR195 pKa = 11.84AAISTCPGTAQPGTATCEE213 pKa = 4.19AQVEE217 pKa = 4.64GANGYY222 pKa = 10.25YY223 pKa = 10.31GGNANDD229 pKa = 4.87DD230 pKa = 3.58NTGVLKK236 pKa = 9.94YY237 pKa = 10.58VRR239 pKa = 11.84VMHH242 pKa = 6.56SGFEE246 pKa = 3.99VLPDD250 pKa = 3.47VEE252 pKa = 5.22LNGITLAGLGSGTTVEE268 pKa = 4.4YY269 pKa = 10.87VQVHH273 pKa = 5.81NSSDD277 pKa = 4.31DD278 pKa = 3.51GFEE281 pKa = 4.14WFGGTVNAKK290 pKa = 10.1YY291 pKa = 10.52LVGTGNDD298 pKa = 4.0DD299 pKa = 3.62DD300 pKa = 5.28TFDD303 pKa = 3.68TDD305 pKa = 2.65SGYY308 pKa = 10.87RR309 pKa = 11.84GGIQFGLILQRR320 pKa = 11.84AGGGDD325 pKa = 3.26RR326 pKa = 11.84MNEE329 pKa = 3.99MSSQDD334 pKa = 3.32LPYY337 pKa = 10.91RR338 pKa = 11.84SMPNLANVTFVGAGHH353 pKa = 7.4DD354 pKa = 3.63NAIVLNQGTLVGYY367 pKa = 9.73YY368 pKa = 9.89NAVVTGGAPACVEE381 pKa = 4.27FQSDD385 pKa = 3.46TTDD388 pKa = 3.29GVFHH392 pKa = 6.22STYY395 pKa = 10.29LSCDD399 pKa = 3.17VPFAGGASGRR409 pKa = 11.84EE410 pKa = 3.53AAAFNAGTNNATGASTLTGGFINGANEE437 pKa = 3.98AAVPAYY443 pKa = 10.34AGLASVNAAFADD455 pKa = 3.34VDD457 pKa = 4.06YY458 pKa = 11.32IGAVKK463 pKa = 10.53DD464 pKa = 5.27AGDD467 pKa = 3.68TWWQGWTCGLTADD480 pKa = 4.67DD481 pKa = 4.6CC482 pKa = 5.0
Molecular weight: 48.94 kDa
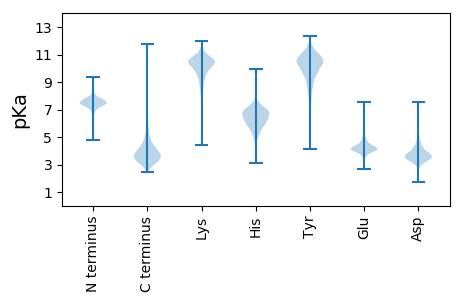
Isoelectric point according different methods:
Protein with the highest isoelectric point:
>tr|A0A0A0EWZ7|A0A0A0EWZ7_9GAMM TonB-dependent receptor OS=Lysobacter arseniciresistens ZS79 OX=913325 GN=N799_08535 PE=3 SV=1
MM1 pKa = 7.14QSKK4 pKa = 10.73LGLRR8 pKa = 11.84KK9 pKa = 9.51SKK11 pKa = 10.3RR12 pKa = 11.84VQLSQLCRR20 pKa = 11.84WRR22 pKa = 11.84TMSMRR27 pKa = 11.84RR28 pKa = 11.84KK29 pKa = 7.98LTKK32 pKa = 10.35RR33 pKa = 11.84LTKK36 pKa = 10.19QSMRR40 pKa = 11.84RR41 pKa = 11.84SIKK44 pKa = 8.86QSRR47 pKa = 11.84SSRR50 pKa = 11.84FQLPTTKK57 pKa = 10.41AWMQQ61 pKa = 3.24
MM1 pKa = 7.14QSKK4 pKa = 10.73LGLRR8 pKa = 11.84KK9 pKa = 9.51SKK11 pKa = 10.3RR12 pKa = 11.84VQLSQLCRR20 pKa = 11.84WRR22 pKa = 11.84TMSMRR27 pKa = 11.84RR28 pKa = 11.84KK29 pKa = 7.98LTKK32 pKa = 10.35RR33 pKa = 11.84LTKK36 pKa = 10.19QSMRR40 pKa = 11.84RR41 pKa = 11.84SIKK44 pKa = 8.86QSRR47 pKa = 11.84SSRR50 pKa = 11.84FQLPTTKK57 pKa = 10.41AWMQQ61 pKa = 3.24
Molecular weight: 7.46 kDa
Isoelectric point according different methods:
Peptides (in silico digests for buttom-up proteomics)
Below you can find in silico digests of the whole proteome with Trypsin, Chymotrypsin, Trypsin+LysC, LysN, ArgC proteases suitable for different mass spec machines.| Try ESI |
 |
|---|
| ChTry ESI |
 |
|---|
| ArgC ESI |
 |
|---|
| LysN ESI |
 |
|---|
| TryLysC ESI |
 |
|---|
| Try MALDI |
 |
|---|
| ChTry MALDI |
 |
|---|
| ArgC MALDI |
 |
|---|
| LysN MALDI |
 |
|---|
| TryLysC MALDI |
 |
|---|
| Try LTQ |
 |
|---|
| ChTry LTQ |
 |
|---|
| ArgC LTQ |
 |
|---|
| LysN LTQ |
 |
|---|
| TryLysC LTQ |
 |
|---|
| Try MSlow |
 |
|---|
| ChTry MSlow |
 |
|---|
| ArgC MSlow |
 |
|---|
| LysN MSlow |
 |
|---|
| TryLysC MSlow |
 |
|---|
| Try MShigh |
 |
|---|
| ChTry MShigh |
 |
|---|
| ArgC MShigh |
 |
|---|
| LysN MShigh |
 |
|---|
| TryLysC MShigh |
 |
|---|
General Statistics
Number of major isoforms |
Number of additional isoforms |
Number of all proteins |
Number of amino acids |
Min. Seq. Length |
Max. Seq. Length |
Avg. Seq. Length |
Avg. Mol. Weight |
|---|---|---|---|---|---|---|---|
0 |
756334 |
41 |
1827 |
320.1 |
34.68 |
Amino acid frequency
Ala |
Cys |
Asp |
Glu |
Phe |
Gly |
His |
Ile |
Lys |
Leu |
|---|---|---|---|---|---|---|---|---|---|
13.355 ± 0.075 | 0.773 ± 0.018 |
6.337 ± 0.047 | 5.692 ± 0.05 |
3.307 ± 0.029 | 8.887 ± 0.045 |
2.28 ± 0.025 | 3.98 ± 0.038 |
2.525 ± 0.044 | 10.654 ± 0.064 |
Met |
Asn |
Gln |
Pro |
Arg |
Ser |
Thr |
Val |
Trp |
Tyr |
|---|---|---|---|---|---|---|---|---|---|
2.224 ± 0.025 | 2.312 ± 0.03 |
5.34 ± 0.04 | 3.365 ± 0.031 |
7.922 ± 0.058 | 4.722 ± 0.038 |
4.859 ± 0.039 | 7.819 ± 0.048 |
1.451 ± 0.022 | 2.197 ± 0.024 |
Most of the basic statistics you can see at this page can be downloaded from this CSV file
Proteome-pI is available under Creative Commons Attribution-NoDerivs license, for more details see here
| Reference: Kozlowski LP. Proteome-pI 2.0: Proteome Isoelectric Point Database Update. Nucleic Acids Res. 2021, doi: 10.1093/nar/gkab944 | Contact: Lukasz P. Kozlowski |
