Clostridium sp. CAG:122
Taxonomy: cellular organisms; Bacteria; Terrabacteria group; Firmicutes; Clostridia; Eubacteriales; Clostridiaceae; Clostridium; environmental samples
Average proteome isoelectric point is 6.32
Get precalculated fractions of proteins

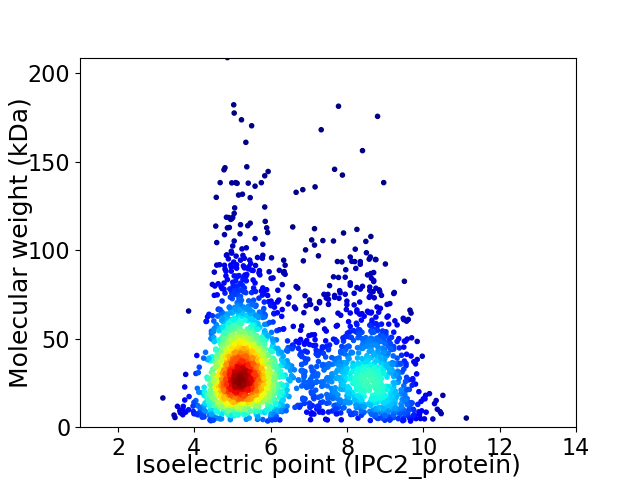
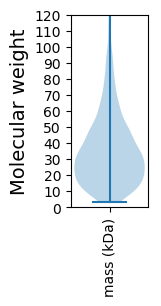
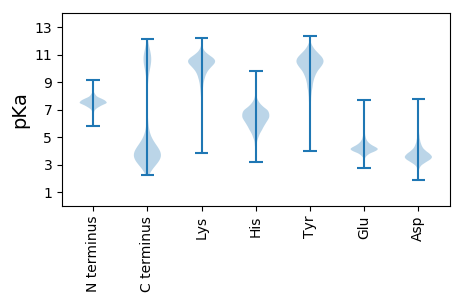
Virtual 2D-PAGE plot for 2543 proteins (isoelectric point calculated using IPC2_protein)
Get csv file with sequences according to given criteria:
* You can choose from 21 different methods for calculating isoelectric point
Summary statistics related to proteome-wise predictions


Protein with the lowest isoelectric point:
>tr|R5RLL5|R5RLL5_9CLOT Stage 0 sporulation protein A homolog OS=Clostridium sp. CAG:122 OX=1262773 GN=BN479_02028 PE=4 SV=1
MM1 pKa = 8.1RR2 pKa = 11.84KK3 pKa = 9.39RR4 pKa = 11.84FLCIICCSMLAFSGCGVGSSVVNNRR29 pKa = 11.84SYY31 pKa = 10.22NTQSEE36 pKa = 4.62SGSSYY41 pKa = 11.56AEE43 pKa = 4.07DD44 pKa = 4.78VEE46 pKa = 4.82DD47 pKa = 4.23TDD49 pKa = 6.2DD50 pKa = 3.84MEE52 pKa = 4.58TDD54 pKa = 2.87EE55 pKa = 6.17DD56 pKa = 5.39YY57 pKa = 11.59YY58 pKa = 11.53DD59 pKa = 4.79EE60 pKa = 5.99DD61 pKa = 3.75SQIYY65 pKa = 9.73DD66 pKa = 3.48VQSKK70 pKa = 8.25YY71 pKa = 11.15LKK73 pKa = 10.49AIQDD77 pKa = 3.64YY78 pKa = 11.26SGTEE82 pKa = 4.09LNDD85 pKa = 3.27LTPDD89 pKa = 3.35NNIEE93 pKa = 4.05NFEE96 pKa = 4.14YY97 pKa = 10.54PEE99 pKa = 5.25DD100 pKa = 3.92EE101 pKa = 5.27SSMQKK106 pKa = 10.27NLNEE110 pKa = 4.09LKK112 pKa = 10.66KK113 pKa = 10.3ILQEE117 pKa = 4.18VYY119 pKa = 10.22GSNVEE124 pKa = 3.91ISFEE128 pKa = 3.9QSSFEE133 pKa = 3.99EE134 pKa = 4.09FDD136 pKa = 3.65VQKK139 pKa = 11.09LNNALSEE146 pKa = 4.88DD147 pKa = 4.01DD148 pKa = 5.76DD149 pKa = 4.85EE150 pKa = 7.69DD151 pKa = 5.68GGDD154 pKa = 3.29VDD156 pKa = 5.81TIEE159 pKa = 4.44TLNKK163 pKa = 8.53TMKK166 pKa = 10.58DD167 pKa = 3.59VVEE170 pKa = 4.74TGCNLQRR177 pKa = 11.84CIKK180 pKa = 10.5SDD182 pKa = 3.11MTFRR186 pKa = 11.84MSGDD190 pKa = 3.33KK191 pKa = 11.41GEE193 pKa = 4.41DD194 pKa = 3.45TQTVASYY201 pKa = 9.97IYY203 pKa = 10.1EE204 pKa = 4.14VDD206 pKa = 3.0GEE208 pKa = 4.85YY209 pKa = 11.6YY210 pKa = 9.48MDD212 pKa = 3.82TYY214 pKa = 11.69AFDD217 pKa = 5.3KK218 pKa = 10.84LLQGQKK224 pKa = 9.03MALEE228 pKa = 4.84EE229 pKa = 4.18KK230 pKa = 10.6QSGNSDD236 pKa = 3.53YY237 pKa = 11.07STADD241 pKa = 3.61LNLDD245 pKa = 3.51QYY247 pKa = 11.64DD248 pKa = 4.26GEE250 pKa = 4.41DD251 pKa = 3.51LNYY254 pKa = 10.83SSLLLDD260 pKa = 3.56QRR262 pKa = 4.33
MM1 pKa = 8.1RR2 pKa = 11.84KK3 pKa = 9.39RR4 pKa = 11.84FLCIICCSMLAFSGCGVGSSVVNNRR29 pKa = 11.84SYY31 pKa = 10.22NTQSEE36 pKa = 4.62SGSSYY41 pKa = 11.56AEE43 pKa = 4.07DD44 pKa = 4.78VEE46 pKa = 4.82DD47 pKa = 4.23TDD49 pKa = 6.2DD50 pKa = 3.84MEE52 pKa = 4.58TDD54 pKa = 2.87EE55 pKa = 6.17DD56 pKa = 5.39YY57 pKa = 11.59YY58 pKa = 11.53DD59 pKa = 4.79EE60 pKa = 5.99DD61 pKa = 3.75SQIYY65 pKa = 9.73DD66 pKa = 3.48VQSKK70 pKa = 8.25YY71 pKa = 11.15LKK73 pKa = 10.49AIQDD77 pKa = 3.64YY78 pKa = 11.26SGTEE82 pKa = 4.09LNDD85 pKa = 3.27LTPDD89 pKa = 3.35NNIEE93 pKa = 4.05NFEE96 pKa = 4.14YY97 pKa = 10.54PEE99 pKa = 5.25DD100 pKa = 3.92EE101 pKa = 5.27SSMQKK106 pKa = 10.27NLNEE110 pKa = 4.09LKK112 pKa = 10.66KK113 pKa = 10.3ILQEE117 pKa = 4.18VYY119 pKa = 10.22GSNVEE124 pKa = 3.91ISFEE128 pKa = 3.9QSSFEE133 pKa = 3.99EE134 pKa = 4.09FDD136 pKa = 3.65VQKK139 pKa = 11.09LNNALSEE146 pKa = 4.88DD147 pKa = 4.01DD148 pKa = 5.76DD149 pKa = 4.85EE150 pKa = 7.69DD151 pKa = 5.68GGDD154 pKa = 3.29VDD156 pKa = 5.81TIEE159 pKa = 4.44TLNKK163 pKa = 8.53TMKK166 pKa = 10.58DD167 pKa = 3.59VVEE170 pKa = 4.74TGCNLQRR177 pKa = 11.84CIKK180 pKa = 10.5SDD182 pKa = 3.11MTFRR186 pKa = 11.84MSGDD190 pKa = 3.33KK191 pKa = 11.41GEE193 pKa = 4.41DD194 pKa = 3.45TQTVASYY201 pKa = 9.97IYY203 pKa = 10.1EE204 pKa = 4.14VDD206 pKa = 3.0GEE208 pKa = 4.85YY209 pKa = 11.6YY210 pKa = 9.48MDD212 pKa = 3.82TYY214 pKa = 11.69AFDD217 pKa = 5.3KK218 pKa = 10.84LLQGQKK224 pKa = 9.03MALEE228 pKa = 4.84EE229 pKa = 4.18KK230 pKa = 10.6QSGNSDD236 pKa = 3.53YY237 pKa = 11.07STADD241 pKa = 3.61LNLDD245 pKa = 3.51QYY247 pKa = 11.64DD248 pKa = 4.26GEE250 pKa = 4.41DD251 pKa = 3.51LNYY254 pKa = 10.83SSLLLDD260 pKa = 3.56QRR262 pKa = 4.33
Molecular weight: 29.83 kDa
Isoelectric point according different methods:
Protein with the highest isoelectric point:
>tr|R5RPU1|R5RPU1_9CLOT Uncharacterized protein conserved in bacteria OS=Clostridium sp. CAG:122 OX=1262773 GN=BN479_02532 PE=4 SV=1
MM1 pKa = 7.67KK2 pKa = 8.72MTFQPKK8 pKa = 9.06KK9 pKa = 8.03RR10 pKa = 11.84SRR12 pKa = 11.84SKK14 pKa = 9.33VHH16 pKa = 6.23GFRR19 pKa = 11.84KK20 pKa = 10.11RR21 pKa = 11.84MQTANGRR28 pKa = 11.84KK29 pKa = 8.71VLASRR34 pKa = 11.84RR35 pKa = 11.84AKK37 pKa = 10.26GRR39 pKa = 11.84HH40 pKa = 5.5KK41 pKa = 10.9LSAA44 pKa = 3.8
MM1 pKa = 7.67KK2 pKa = 8.72MTFQPKK8 pKa = 9.06KK9 pKa = 8.03RR10 pKa = 11.84SRR12 pKa = 11.84SKK14 pKa = 9.33VHH16 pKa = 6.23GFRR19 pKa = 11.84KK20 pKa = 10.11RR21 pKa = 11.84MQTANGRR28 pKa = 11.84KK29 pKa = 8.71VLASRR34 pKa = 11.84RR35 pKa = 11.84AKK37 pKa = 10.26GRR39 pKa = 11.84HH40 pKa = 5.5KK41 pKa = 10.9LSAA44 pKa = 3.8
Molecular weight: 5.15 kDa
Isoelectric point according different methods:
Peptides (in silico digests for buttom-up proteomics)
Below you can find in silico digests of the whole proteome with Trypsin, Chymotrypsin, Trypsin+LysC, LysN, ArgC proteases suitable for different mass spec machines.| Try ESI |
 |
|---|
| ChTry ESI |
 |
|---|
| ArgC ESI |
 |
|---|
| LysN ESI |
 |
|---|
| TryLysC ESI |
 |
|---|
| Try MALDI |
 |
|---|
| ChTry MALDI |
 |
|---|
| ArgC MALDI |
 |
|---|
| LysN MALDI |
 |
|---|
| TryLysC MALDI |
 |
|---|
| Try LTQ |
 |
|---|
| ChTry LTQ |
 |
|---|
| ArgC LTQ |
 |
|---|
| LysN LTQ |
 |
|---|
| TryLysC LTQ |
 |
|---|
| Try MSlow |
 |
|---|
| ChTry MSlow |
 |
|---|
| ArgC MSlow |
 |
|---|
| LysN MSlow |
 |
|---|
| TryLysC MSlow |
 |
|---|
| Try MShigh |
 |
|---|
| ChTry MShigh |
 |
|---|
| ArgC MShigh |
 |
|---|
| LysN MShigh |
 |
|---|
| TryLysC MShigh |
 |
|---|
General Statistics
Number of major isoforms |
Number of additional isoforms |
Number of all proteins |
Number of amino acids |
Min. Seq. Length |
Max. Seq. Length |
Avg. Seq. Length |
Avg. Mol. Weight |
|---|---|---|---|---|---|---|---|
0 |
847896 |
30 |
1818 |
333.4 |
37.53 |
Amino acid frequency
Ala |
Cys |
Asp |
Glu |
Phe |
Gly |
His |
Ile |
Lys |
Leu |
|---|---|---|---|---|---|---|---|---|---|
6.678 ± 0.049 | 1.426 ± 0.019 |
6.256 ± 0.038 | 7.179 ± 0.052 |
4.106 ± 0.036 | 6.585 ± 0.04 |
1.505 ± 0.018 | 8.185 ± 0.047 |
8.901 ± 0.058 | 7.909 ± 0.048 |
Met |
Asn |
Gln |
Pro |
Arg |
Ser |
Thr |
Val |
Trp |
Tyr |
|---|---|---|---|---|---|---|---|---|---|
3.081 ± 0.029 | 5.327 ± 0.033 |
2.721 ± 0.024 | 2.659 ± 0.027 |
3.67 ± 0.037 | 6.331 ± 0.04 |
5.408 ± 0.049 | 6.882 ± 0.041 |
0.764 ± 0.014 | 4.421 ± 0.037 |
Most of the basic statistics you can see at this page can be downloaded from this CSV file
Proteome-pI is available under Creative Commons Attribution-NoDerivs license, for more details see here
| Reference: Kozlowski LP. Proteome-pI 2.0: Proteome Isoelectric Point Database Update. Nucleic Acids Res. 2021, doi: 10.1093/nar/gkab944 | Contact: Lukasz P. Kozlowski |
