Chryseobacterium sp.
Taxonomy: cellular organisms; Bacteria; FCB group; Bacteroidetes/Chlorobi group; Bacteroidetes; Flavobacteriia; Flavobacteriales; Weeksellaceae; Chryseobacterium group; Chryseobacterium; unclassified Chryseobacterium
Average proteome isoelectric point is 6.55
Get precalculated fractions of proteins

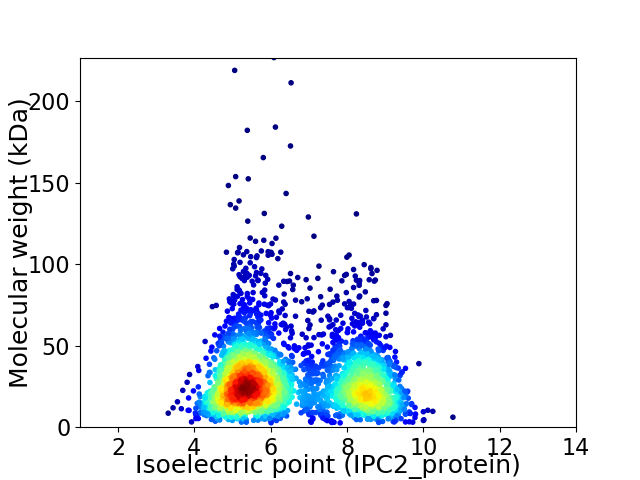
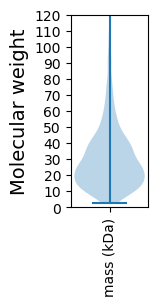
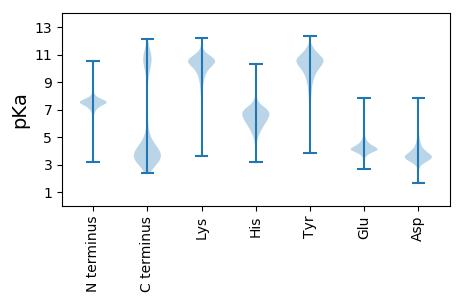
Virtual 2D-PAGE plot for 3175 proteins (isoelectric point calculated using IPC2_protein)
Get csv file with sequences according to given criteria:
* You can choose from 21 different methods for calculating isoelectric point
Summary statistics related to proteome-wise predictions


Protein with the lowest isoelectric point:
>tr|A0A519LI26|A0A519LI26_9FLAO Restriction endonuclease (Fragment) OS=Chryseobacterium sp. OX=1871047 GN=EOO19_06625 PE=4 SV=1
MM1 pKa = 7.38NEE3 pKa = 3.19SWLQKK8 pKa = 9.2WEE10 pKa = 4.01EE11 pKa = 4.07VKK13 pKa = 10.9DD14 pKa = 3.9VLVCPTDD21 pKa = 3.36LEE23 pKa = 4.98TYY25 pKa = 7.49FTSNEE30 pKa = 3.57ILGQKK35 pKa = 8.89MEE37 pKa = 4.14TMEE40 pKa = 4.62IGNVSLPSGKK50 pKa = 9.48IVVRR54 pKa = 11.84DD55 pKa = 3.49PLVYY59 pKa = 10.59LSSDD63 pKa = 3.31EE64 pKa = 4.1KK65 pKa = 10.95PYY67 pKa = 10.59FIQAPKK73 pKa = 11.1GNFLVTIAVVKK84 pKa = 10.92SEE86 pKa = 4.12DD87 pKa = 3.02WGDD90 pKa = 3.2RR91 pKa = 11.84YY92 pKa = 11.02AVVKK96 pKa = 10.33VQFTQKK102 pKa = 10.38KK103 pKa = 7.31PVVYY107 pKa = 10.09RR108 pKa = 11.84EE109 pKa = 3.98ALIGIEE115 pKa = 4.13DD116 pKa = 4.29LEE118 pKa = 5.15DD119 pKa = 3.35VTEE122 pKa = 4.74DD123 pKa = 3.63DD124 pKa = 4.57FFGFSVDD131 pKa = 4.21AGLGCITDD139 pKa = 4.17AEE141 pKa = 4.47VLPSVDD147 pKa = 3.26QFVAATDD154 pKa = 3.41VDD156 pKa = 4.11NVYY159 pKa = 11.28DD160 pKa = 4.54DD161 pKa = 4.1YY162 pKa = 11.27FAEE165 pKa = 5.16IFAQSYY171 pKa = 10.11KK172 pKa = 10.74DD173 pKa = 3.41HH174 pKa = 7.47PNNQRR179 pKa = 11.84DD180 pKa = 3.45AGDD183 pKa = 4.08WINWTVPNTDD193 pKa = 3.05YY194 pKa = 10.66QIPMFASGFGDD205 pKa = 3.74GSYY208 pKa = 10.54PVYY211 pKa = 10.07FAYY214 pKa = 10.21DD215 pKa = 3.32AHH217 pKa = 8.6GEE219 pKa = 3.97ICGLYY224 pKa = 9.45IQFIDD229 pKa = 3.8VEE231 pKa = 4.31LALTEE236 pKa = 5.24DD237 pKa = 4.46GDD239 pKa = 4.84DD240 pKa = 4.04EE241 pKa = 5.17DD242 pKa = 5.56VEE244 pKa = 4.43
MM1 pKa = 7.38NEE3 pKa = 3.19SWLQKK8 pKa = 9.2WEE10 pKa = 4.01EE11 pKa = 4.07VKK13 pKa = 10.9DD14 pKa = 3.9VLVCPTDD21 pKa = 3.36LEE23 pKa = 4.98TYY25 pKa = 7.49FTSNEE30 pKa = 3.57ILGQKK35 pKa = 8.89MEE37 pKa = 4.14TMEE40 pKa = 4.62IGNVSLPSGKK50 pKa = 9.48IVVRR54 pKa = 11.84DD55 pKa = 3.49PLVYY59 pKa = 10.59LSSDD63 pKa = 3.31EE64 pKa = 4.1KK65 pKa = 10.95PYY67 pKa = 10.59FIQAPKK73 pKa = 11.1GNFLVTIAVVKK84 pKa = 10.92SEE86 pKa = 4.12DD87 pKa = 3.02WGDD90 pKa = 3.2RR91 pKa = 11.84YY92 pKa = 11.02AVVKK96 pKa = 10.33VQFTQKK102 pKa = 10.38KK103 pKa = 7.31PVVYY107 pKa = 10.09RR108 pKa = 11.84EE109 pKa = 3.98ALIGIEE115 pKa = 4.13DD116 pKa = 4.29LEE118 pKa = 5.15DD119 pKa = 3.35VTEE122 pKa = 4.74DD123 pKa = 3.63DD124 pKa = 4.57FFGFSVDD131 pKa = 4.21AGLGCITDD139 pKa = 4.17AEE141 pKa = 4.47VLPSVDD147 pKa = 3.26QFVAATDD154 pKa = 3.41VDD156 pKa = 4.11NVYY159 pKa = 11.28DD160 pKa = 4.54DD161 pKa = 4.1YY162 pKa = 11.27FAEE165 pKa = 5.16IFAQSYY171 pKa = 10.11KK172 pKa = 10.74DD173 pKa = 3.41HH174 pKa = 7.47PNNQRR179 pKa = 11.84DD180 pKa = 3.45AGDD183 pKa = 4.08WINWTVPNTDD193 pKa = 3.05YY194 pKa = 10.66QIPMFASGFGDD205 pKa = 3.74GSYY208 pKa = 10.54PVYY211 pKa = 10.07FAYY214 pKa = 10.21DD215 pKa = 3.32AHH217 pKa = 8.6GEE219 pKa = 3.97ICGLYY224 pKa = 9.45IQFIDD229 pKa = 3.8VEE231 pKa = 4.31LALTEE236 pKa = 5.24DD237 pKa = 4.46GDD239 pKa = 4.84DD240 pKa = 4.04EE241 pKa = 5.17DD242 pKa = 5.56VEE244 pKa = 4.43
Molecular weight: 27.55 kDa
Isoelectric point according different methods:
Protein with the highest isoelectric point:
>tr|A0A519KY54|A0A519KY54_9FLAO Non-ribosomal peptide synthetase (Fragment) OS=Chryseobacterium sp. OX=1871047 GN=EOO19_14150 PE=4 SV=1
MM1 pKa = 7.69SKK3 pKa = 9.0RR4 pKa = 11.84TFQPSEE10 pKa = 3.59RR11 pKa = 11.84KK12 pKa = 9.33RR13 pKa = 11.84RR14 pKa = 11.84NKK16 pKa = 10.03HH17 pKa = 3.97GFRR20 pKa = 11.84EE21 pKa = 4.33RR22 pKa = 11.84MSTPNGRR29 pKa = 11.84RR30 pKa = 11.84VLAARR35 pKa = 11.84RR36 pKa = 11.84AKK38 pKa = 9.98GRR40 pKa = 11.84KK41 pKa = 8.8SLTVSAQRR49 pKa = 11.84AKK51 pKa = 10.68RR52 pKa = 3.52
MM1 pKa = 7.69SKK3 pKa = 9.0RR4 pKa = 11.84TFQPSEE10 pKa = 3.59RR11 pKa = 11.84KK12 pKa = 9.33RR13 pKa = 11.84RR14 pKa = 11.84NKK16 pKa = 10.03HH17 pKa = 3.97GFRR20 pKa = 11.84EE21 pKa = 4.33RR22 pKa = 11.84MSTPNGRR29 pKa = 11.84RR30 pKa = 11.84VLAARR35 pKa = 11.84RR36 pKa = 11.84AKK38 pKa = 9.98GRR40 pKa = 11.84KK41 pKa = 8.8SLTVSAQRR49 pKa = 11.84AKK51 pKa = 10.68RR52 pKa = 3.52
Molecular weight: 6.14 kDa
Isoelectric point according different methods:
Peptides (in silico digests for buttom-up proteomics)
Below you can find in silico digests of the whole proteome with Trypsin, Chymotrypsin, Trypsin+LysC, LysN, ArgC proteases suitable for different mass spec machines.| Try ESI |
 |
|---|
| ChTry ESI |
 |
|---|
| ArgC ESI |
 |
|---|
| LysN ESI |
 |
|---|
| TryLysC ESI |
 |
|---|
| Try MALDI |
 |
|---|
| ChTry MALDI |
 |
|---|
| ArgC MALDI |
 |
|---|
| LysN MALDI |
 |
|---|
| TryLysC MALDI |
 |
|---|
| Try LTQ |
 |
|---|
| ChTry LTQ |
 |
|---|
| ArgC LTQ |
 |
|---|
| LysN LTQ |
 |
|---|
| TryLysC LTQ |
 |
|---|
| Try MSlow |
 |
|---|
| ChTry MSlow |
 |
|---|
| ArgC MSlow |
 |
|---|
| LysN MSlow |
 |
|---|
| TryLysC MSlow |
 |
|---|
| Try MShigh |
 |
|---|
| ChTry MShigh |
 |
|---|
| ArgC MShigh |
 |
|---|
| LysN MShigh |
 |
|---|
| TryLysC MShigh |
 |
|---|
General Statistics
Number of major isoforms |
Number of additional isoforms |
Number of all proteins |
Number of amino acids |
Min. Seq. Length |
Max. Seq. Length |
Avg. Seq. Length |
Avg. Mol. Weight |
|---|---|---|---|---|---|---|---|
0 |
888173 |
23 |
1977 |
279.7 |
31.79 |
Amino acid frequency
Ala |
Cys |
Asp |
Glu |
Phe |
Gly |
His |
Ile |
Lys |
Leu |
|---|---|---|---|---|---|---|---|---|---|
5.965 ± 0.042 | 0.74 ± 0.013 |
5.608 ± 0.031 | 7.134 ± 0.053 |
5.527 ± 0.033 | 5.916 ± 0.042 |
1.744 ± 0.021 | 7.992 ± 0.039 |
8.727 ± 0.045 | 9.108 ± 0.043 |
Met |
Asn |
Gln |
Pro |
Arg |
Ser |
Thr |
Val |
Trp |
Tyr |
|---|---|---|---|---|---|---|---|---|---|
2.271 ± 0.02 | 6.339 ± 0.046 |
3.294 ± 0.027 | 3.598 ± 0.026 |
3.268 ± 0.028 | 6.597 ± 0.036 |
5.299 ± 0.036 | 5.842 ± 0.03 |
1.052 ± 0.015 | 3.981 ± 0.031 |
Most of the basic statistics you can see at this page can be downloaded from this CSV file
Proteome-pI is available under Creative Commons Attribution-NoDerivs license, for more details see here
| Reference: Kozlowski LP. Proteome-pI 2.0: Proteome Isoelectric Point Database Update. Nucleic Acids Res. 2021, doi: 10.1093/nar/gkab944 | Contact: Lukasz P. Kozlowski |
