Bifidobacterium choerinum
Taxonomy: cellular organisms; Bacteria; Terrabacteria group; Actinobacteria; Actinomycetia; Bifidobacteriales; Bifidobacteriaceae; Bifidobacterium
Average proteome isoelectric point is 5.92
Get precalculated fractions of proteins

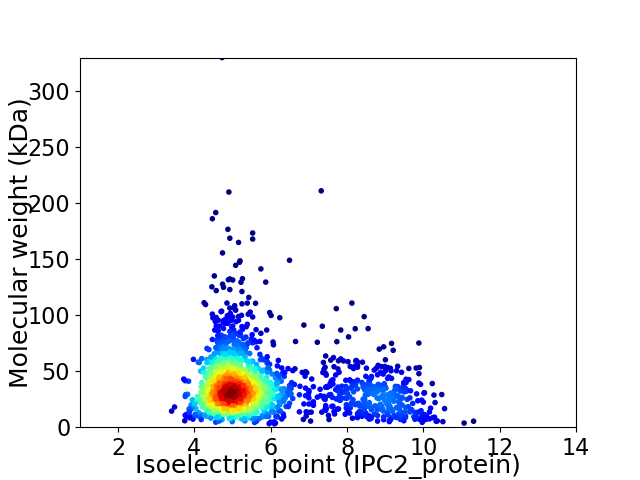
Virtual 2D-PAGE plot for 1672 proteins (isoelectric point calculated using IPC2_protein)
Get csv file with sequences according to given criteria:
* You can choose from 21 different methods for calculating isoelectric point
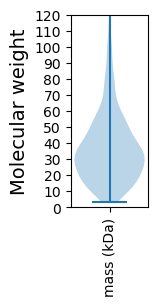
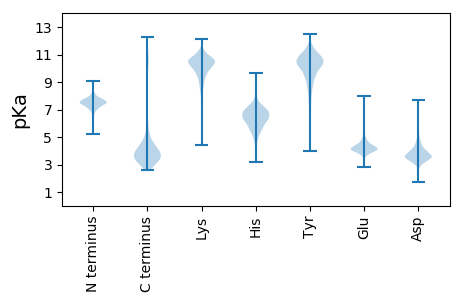
Summary statistics related to proteome-wise predictions


Protein with the lowest isoelectric point:
>tr|A0A087AE55|A0A087AE55_9BIFI Putative serine/threonine-protein kinase PknK OS=Bifidobacterium choerinum OX=35760 GN=BCHO_0729 PE=4 SV=1
MM1 pKa = 7.33VSYY4 pKa = 10.82DD5 pKa = 3.58DD6 pKa = 4.52AVAIIQDD13 pKa = 3.81PQADD17 pKa = 4.1PVTLAKK23 pKa = 10.04VAYY26 pKa = 7.25EE27 pKa = 3.96NPEE30 pKa = 3.71FGANVAAHH38 pKa = 5.94PRR40 pKa = 11.84AYY42 pKa = 9.64PGLLRR47 pKa = 11.84WIAQFGDD54 pKa = 3.02EE55 pKa = 4.17RR56 pKa = 11.84ARR58 pKa = 11.84ATVAQLGYY66 pKa = 10.01HH67 pKa = 5.39SQLGAVEE74 pKa = 4.38DD75 pKa = 4.23RR76 pKa = 11.84QVDD79 pKa = 3.45AAAIDD84 pKa = 3.66EE85 pKa = 4.5AAAIAAAIDD94 pKa = 3.54AAQANAASRR103 pKa = 11.84PTAAASPAVDD113 pKa = 3.48NVAGGLVMNAATAGDD128 pKa = 4.06EE129 pKa = 4.18AQPIASQTGTVEE141 pKa = 4.17YY142 pKa = 10.52ASVEE146 pKa = 3.98AQPVSFEE153 pKa = 4.21PAQQTGVDD161 pKa = 3.64MLSEE165 pKa = 4.02QFNNIGMDD173 pKa = 3.75ASQTNMDD180 pKa = 4.22ASQSAAASPSVAAPDD195 pKa = 3.93MAQQPMMDD203 pKa = 3.39QAQPADD209 pKa = 3.92AYY211 pKa = 10.9AQIQATNPYY220 pKa = 9.94GFTAEE225 pKa = 4.23VAMTTPDD232 pKa = 3.55TTVMQQIAQYY242 pKa = 10.91APEE245 pKa = 4.46LHH247 pKa = 6.85PALAQNPYY255 pKa = 9.92IYY257 pKa = 10.08PEE259 pKa = 4.23LLSWLGMLGEE269 pKa = 4.48PATNASIAQRR279 pKa = 11.84QQQQ282 pKa = 3.02
MM1 pKa = 7.33VSYY4 pKa = 10.82DD5 pKa = 3.58DD6 pKa = 4.52AVAIIQDD13 pKa = 3.81PQADD17 pKa = 4.1PVTLAKK23 pKa = 10.04VAYY26 pKa = 7.25EE27 pKa = 3.96NPEE30 pKa = 3.71FGANVAAHH38 pKa = 5.94PRR40 pKa = 11.84AYY42 pKa = 9.64PGLLRR47 pKa = 11.84WIAQFGDD54 pKa = 3.02EE55 pKa = 4.17RR56 pKa = 11.84ARR58 pKa = 11.84ATVAQLGYY66 pKa = 10.01HH67 pKa = 5.39SQLGAVEE74 pKa = 4.38DD75 pKa = 4.23RR76 pKa = 11.84QVDD79 pKa = 3.45AAAIDD84 pKa = 3.66EE85 pKa = 4.5AAAIAAAIDD94 pKa = 3.54AAQANAASRR103 pKa = 11.84PTAAASPAVDD113 pKa = 3.48NVAGGLVMNAATAGDD128 pKa = 4.06EE129 pKa = 4.18AQPIASQTGTVEE141 pKa = 4.17YY142 pKa = 10.52ASVEE146 pKa = 3.98AQPVSFEE153 pKa = 4.21PAQQTGVDD161 pKa = 3.64MLSEE165 pKa = 4.02QFNNIGMDD173 pKa = 3.75ASQTNMDD180 pKa = 4.22ASQSAAASPSVAAPDD195 pKa = 3.93MAQQPMMDD203 pKa = 3.39QAQPADD209 pKa = 3.92AYY211 pKa = 10.9AQIQATNPYY220 pKa = 9.94GFTAEE225 pKa = 4.23VAMTTPDD232 pKa = 3.55TTVMQQIAQYY242 pKa = 10.91APEE245 pKa = 4.46LHH247 pKa = 6.85PALAQNPYY255 pKa = 9.92IYY257 pKa = 10.08PEE259 pKa = 4.23LLSWLGMLGEE269 pKa = 4.48PATNASIAQRR279 pKa = 11.84QQQQ282 pKa = 3.02
Molecular weight: 29.44 kDa
Isoelectric point according different methods:
Protein with the highest isoelectric point:
>tr|A0A087AGV6|A0A087AGV6_9BIFI Tellurite resistance protein TerB OS=Bifidobacterium choerinum OX=35760 GN=BCHO_0086 PE=4 SV=1
MM1 pKa = 7.44KK2 pKa = 9.6RR3 pKa = 11.84TFQPNNRR10 pKa = 11.84RR11 pKa = 11.84RR12 pKa = 11.84HH13 pKa = 4.79MKK15 pKa = 9.36HH16 pKa = 5.81GFRR19 pKa = 11.84ARR21 pKa = 11.84MRR23 pKa = 11.84TRR25 pKa = 11.84SGRR28 pKa = 11.84ALINRR33 pKa = 11.84RR34 pKa = 11.84RR35 pKa = 11.84AKK37 pKa = 10.1GRR39 pKa = 11.84KK40 pKa = 6.41TLSAA44 pKa = 4.15
MM1 pKa = 7.44KK2 pKa = 9.6RR3 pKa = 11.84TFQPNNRR10 pKa = 11.84RR11 pKa = 11.84RR12 pKa = 11.84HH13 pKa = 4.79MKK15 pKa = 9.36HH16 pKa = 5.81GFRR19 pKa = 11.84ARR21 pKa = 11.84MRR23 pKa = 11.84TRR25 pKa = 11.84SGRR28 pKa = 11.84ALINRR33 pKa = 11.84RR34 pKa = 11.84RR35 pKa = 11.84AKK37 pKa = 10.1GRR39 pKa = 11.84KK40 pKa = 6.41TLSAA44 pKa = 4.15
Molecular weight: 5.36 kDa
Isoelectric point according different methods:
Peptides (in silico digests for buttom-up proteomics)
Below you can find in silico digests of the whole proteome with Trypsin, Chymotrypsin, Trypsin+LysC, LysN, ArgC proteases suitable for different mass spec machines.| Try ESI |
 |
|---|
| ChTry ESI |
 |
|---|
| ArgC ESI |
 |
|---|
| LysN ESI |
 |
|---|
| TryLysC ESI |
 |
|---|
| Try MALDI |
 |
|---|
| ChTry MALDI |
 |
|---|
| ArgC MALDI |
 |
|---|
| LysN MALDI |
 |
|---|
| TryLysC MALDI |
 |
|---|
| Try LTQ |
 |
|---|
| ChTry LTQ |
 |
|---|
| ArgC LTQ |
 |
|---|
| LysN LTQ |
 |
|---|
| TryLysC LTQ |
 |
|---|
| Try MSlow |
 |
|---|
| ChTry MSlow |
 |
|---|
| ArgC MSlow |
 |
|---|
| LysN MSlow |
 |
|---|
| TryLysC MSlow |
 |
|---|
| Try MShigh |
 |
|---|
| ChTry MShigh |
 |
|---|
| ArgC MShigh |
 |
|---|
| LysN MShigh |
 |
|---|
| TryLysC MShigh |
 |
|---|
General Statistics
Number of major isoforms |
Number of additional isoforms |
Number of all proteins |
Number of amino acids |
Min. Seq. Length |
Max. Seq. Length |
Avg. Seq. Length |
Avg. Mol. Weight |
|---|---|---|---|---|---|---|---|
0 |
597285 |
29 |
3109 |
357.2 |
39.01 |
Amino acid frequency
Ala |
Cys |
Asp |
Glu |
Phe |
Gly |
His |
Ile |
Lys |
Leu |
|---|---|---|---|---|---|---|---|---|---|
11.639 ± 0.086 | 0.979 ± 0.019 |
7.262 ± 0.057 | 5.714 ± 0.057 |
3.326 ± 0.037 | 7.97 ± 0.044 |
2.3 ± 0.026 | 5.089 ± 0.043 |
3.484 ± 0.053 | 8.583 ± 0.062 |
Met |
Asn |
Gln |
Pro |
Arg |
Ser |
Thr |
Val |
Trp |
Tyr |
|---|---|---|---|---|---|---|---|---|---|
2.715 ± 0.024 | 2.976 ± 0.042 |
4.743 ± 0.04 | 3.309 ± 0.04 |
6.64 ± 0.065 | 5.351 ± 0.047 |
6.0 ± 0.052 | 7.885 ± 0.052 |
1.354 ± 0.025 | 2.683 ± 0.035 |
Most of the basic statistics you can see at this page can be downloaded from this CSV file
Proteome-pI is available under Creative Commons Attribution-NoDerivs license, for more details see here
| Reference: Kozlowski LP. Proteome-pI 2.0: Proteome Isoelectric Point Database Update. Nucleic Acids Res. 2021, doi: 10.1093/nar/gkab944 | Contact: Lukasz P. Kozlowski |
