Niveispirillum lacus
Taxonomy: cellular organisms; Bacteria; Proteobacteria; Alphaproteobacteria; Rhodospirillales; Azospirillaceae; Niveispirillum
Average proteome isoelectric point is 6.58
Get precalculated fractions of proteins

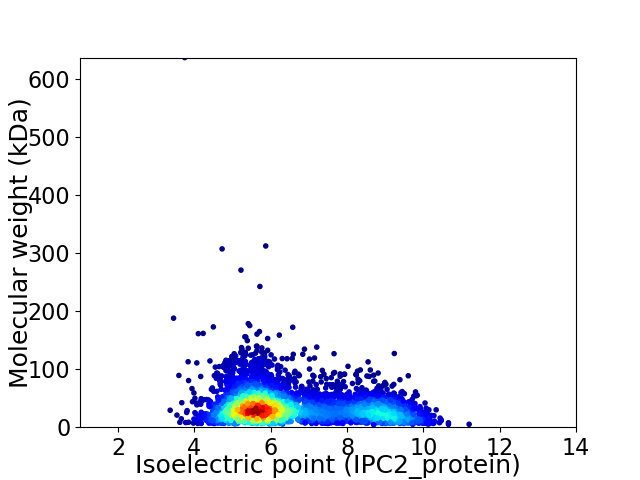
Virtual 2D-PAGE plot for 4265 proteins (isoelectric point calculated using IPC2_protein)
Get csv file with sequences according to given criteria:
* You can choose from 21 different methods for calculating isoelectric point
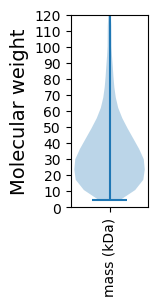
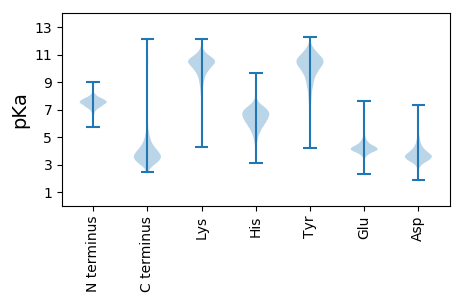
Summary statistics related to proteome-wise predictions


Protein with the lowest isoelectric point:
>tr|A0A255Z4Z5|A0A255Z4Z5_9PROT DNA-binding protein OS=Niveispirillum lacus OX=1981099 GN=CHU95_04700 PE=4 SV=1
MM1 pKa = 7.29PHH3 pKa = 6.86KK4 pKa = 9.58EE5 pKa = 3.23WFMRR9 pKa = 11.84FSKK12 pKa = 10.52FVASTAIALAMLGGAAAAQAEE33 pKa = 4.39DD34 pKa = 3.68ASFSFSGTAAITSDD48 pKa = 3.76YY49 pKa = 10.87VFRR52 pKa = 11.84GYY54 pKa = 10.5SQTDD58 pKa = 3.21SDD60 pKa = 4.36PAFQAGLTASHH71 pKa = 6.76EE72 pKa = 4.58SGFFVSAWGSNVDD85 pKa = 4.36LGSDD89 pKa = 3.23ADD91 pKa = 3.92IEE93 pKa = 4.29VDD95 pKa = 5.66LIAGYY100 pKa = 8.64TNSVDD105 pKa = 3.16NLTYY109 pKa = 10.32TVGAYY114 pKa = 10.36YY115 pKa = 8.75YY116 pKa = 8.3TYY118 pKa = 10.5PGADD122 pKa = 3.11GSAEE126 pKa = 3.64FDD128 pKa = 3.71YY129 pKa = 11.53FEE131 pKa = 6.29AGLDD135 pKa = 3.33LAYY138 pKa = 10.4AIDD141 pKa = 4.31KK142 pKa = 8.52VTLTGKK148 pKa = 10.38LYY150 pKa = 10.48YY151 pKa = 10.52SPEE154 pKa = 3.95FFGAAGGDD162 pKa = 2.79AWYY165 pKa = 8.88FAGGTSVAVTEE176 pKa = 4.43TVSVYY181 pKa = 10.8GAIGFNEE188 pKa = 4.47LDD190 pKa = 3.78NGTDD194 pKa = 3.54YY195 pKa = 11.4QDD197 pKa = 3.71YY198 pKa = 10.75QGGIAVKK205 pKa = 10.26FDD207 pKa = 3.87PFVLDD212 pKa = 4.99LKK214 pKa = 10.56YY215 pKa = 9.6TDD217 pKa = 4.13TDD219 pKa = 3.67VKK221 pKa = 11.04GAGPLGDD228 pKa = 3.57SRR230 pKa = 11.84FVATLTYY237 pKa = 11.07AFF239 pKa = 4.8
MM1 pKa = 7.29PHH3 pKa = 6.86KK4 pKa = 9.58EE5 pKa = 3.23WFMRR9 pKa = 11.84FSKK12 pKa = 10.52FVASTAIALAMLGGAAAAQAEE33 pKa = 4.39DD34 pKa = 3.68ASFSFSGTAAITSDD48 pKa = 3.76YY49 pKa = 10.87VFRR52 pKa = 11.84GYY54 pKa = 10.5SQTDD58 pKa = 3.21SDD60 pKa = 4.36PAFQAGLTASHH71 pKa = 6.76EE72 pKa = 4.58SGFFVSAWGSNVDD85 pKa = 4.36LGSDD89 pKa = 3.23ADD91 pKa = 3.92IEE93 pKa = 4.29VDD95 pKa = 5.66LIAGYY100 pKa = 8.64TNSVDD105 pKa = 3.16NLTYY109 pKa = 10.32TVGAYY114 pKa = 10.36YY115 pKa = 8.75YY116 pKa = 8.3TYY118 pKa = 10.5PGADD122 pKa = 3.11GSAEE126 pKa = 3.64FDD128 pKa = 3.71YY129 pKa = 11.53FEE131 pKa = 6.29AGLDD135 pKa = 3.33LAYY138 pKa = 10.4AIDD141 pKa = 4.31KK142 pKa = 8.52VTLTGKK148 pKa = 10.38LYY150 pKa = 10.48YY151 pKa = 10.52SPEE154 pKa = 3.95FFGAAGGDD162 pKa = 2.79AWYY165 pKa = 8.88FAGGTSVAVTEE176 pKa = 4.43TVSVYY181 pKa = 10.8GAIGFNEE188 pKa = 4.47LDD190 pKa = 3.78NGTDD194 pKa = 3.54YY195 pKa = 11.4QDD197 pKa = 3.71YY198 pKa = 10.75QGGIAVKK205 pKa = 10.26FDD207 pKa = 3.87PFVLDD212 pKa = 4.99LKK214 pKa = 10.56YY215 pKa = 9.6TDD217 pKa = 4.13TDD219 pKa = 3.67VKK221 pKa = 11.04GAGPLGDD228 pKa = 3.57SRR230 pKa = 11.84FVATLTYY237 pKa = 11.07AFF239 pKa = 4.8
Molecular weight: 25.44 kDa
Isoelectric point according different methods:
Protein with the highest isoelectric point:
>tr|A0A255Z0H4|A0A255Z0H4_9PROT Ferredoxin OS=Niveispirillum lacus OX=1981099 GN=CHU95_10320 PE=4 SV=1
MM1 pKa = 7.49KK2 pKa = 10.41RR3 pKa = 11.84PFQPSKK9 pKa = 9.2IVRR12 pKa = 11.84ARR14 pKa = 11.84RR15 pKa = 11.84HH16 pKa = 4.49GFRR19 pKa = 11.84ARR21 pKa = 11.84MATAAGRR28 pKa = 11.84NIINKK33 pKa = 9.09RR34 pKa = 11.84RR35 pKa = 11.84AQGRR39 pKa = 11.84KK40 pKa = 9.19KK41 pKa = 10.65LSAA44 pKa = 3.91
MM1 pKa = 7.49KK2 pKa = 10.41RR3 pKa = 11.84PFQPSKK9 pKa = 9.2IVRR12 pKa = 11.84ARR14 pKa = 11.84RR15 pKa = 11.84HH16 pKa = 4.49GFRR19 pKa = 11.84ARR21 pKa = 11.84MATAAGRR28 pKa = 11.84NIINKK33 pKa = 9.09RR34 pKa = 11.84RR35 pKa = 11.84AQGRR39 pKa = 11.84KK40 pKa = 9.19KK41 pKa = 10.65LSAA44 pKa = 3.91
Molecular weight: 5.09 kDa
Isoelectric point according different methods:
Peptides (in silico digests for buttom-up proteomics)
Below you can find in silico digests of the whole proteome with Trypsin, Chymotrypsin, Trypsin+LysC, LysN, ArgC proteases suitable for different mass spec machines.| Try ESI |
 |
|---|
| ChTry ESI |
 |
|---|
| ArgC ESI |
 |
|---|
| LysN ESI |
 |
|---|
| TryLysC ESI |
 |
|---|
| Try MALDI |
 |
|---|
| ChTry MALDI |
 |
|---|
| ArgC MALDI |
 |
|---|
| LysN MALDI |
 |
|---|
| TryLysC MALDI |
 |
|---|
| Try LTQ |
 |
|---|
| ChTry LTQ |
 |
|---|
| ArgC LTQ |
 |
|---|
| LysN LTQ |
 |
|---|
| TryLysC LTQ |
 |
|---|
| Try MSlow |
 |
|---|
| ChTry MSlow |
 |
|---|
| ArgC MSlow |
 |
|---|
| LysN MSlow |
 |
|---|
| TryLysC MSlow |
 |
|---|
| Try MShigh |
 |
|---|
| ChTry MShigh |
 |
|---|
| ArgC MShigh |
 |
|---|
| LysN MShigh |
 |
|---|
| TryLysC MShigh |
 |
|---|
General Statistics
Number of major isoforms |
Number of additional isoforms |
Number of all proteins |
Number of amino acids |
Min. Seq. Length |
Max. Seq. Length |
Avg. Seq. Length |
Avg. Mol. Weight |
|---|---|---|---|---|---|---|---|
0 |
1464700 |
41 |
6470 |
343.4 |
37.13 |
Amino acid frequency
Ala |
Cys |
Asp |
Glu |
Phe |
Gly |
His |
Ile |
Lys |
Leu |
|---|---|---|---|---|---|---|---|---|---|
12.494 ± 0.053 | 0.8 ± 0.013 |
5.995 ± 0.028 | 4.971 ± 0.035 |
3.417 ± 0.024 | 8.907 ± 0.049 |
2.031 ± 0.021 | 4.725 ± 0.024 |
2.965 ± 0.03 | 10.72 ± 0.053 |
Met |
Asn |
Gln |
Pro |
Arg |
Ser |
Thr |
Val |
Trp |
Tyr |
|---|---|---|---|---|---|---|---|---|---|
2.461 ± 0.018 | 2.635 ± 0.024 |
5.474 ± 0.038 | 3.367 ± 0.025 |
7.218 ± 0.045 | 5.116 ± 0.04 |
5.678 ± 0.056 | 7.449 ± 0.03 |
1.41 ± 0.016 | 2.167 ± 0.02 |
Most of the basic statistics you can see at this page can be downloaded from this CSV file
Proteome-pI is available under Creative Commons Attribution-NoDerivs license, for more details see here
| Reference: Kozlowski LP. Proteome-pI 2.0: Proteome Isoelectric Point Database Update. Nucleic Acids Res. 2021, doi: 10.1093/nar/gkab944 | Contact: Lukasz P. Kozlowski |
