Escherichia phage phi G17
Taxonomy: Viruses; Duplodnaviria; Heunggongvirae; Uroviricota; Caudoviricetes; Caudovirales; Schitoviridae; Enquatrovirinae; Gamaleyavirus; unclassified Gamaleyavirus
Average proteome isoelectric point is 6.27
Get precalculated fractions of proteins

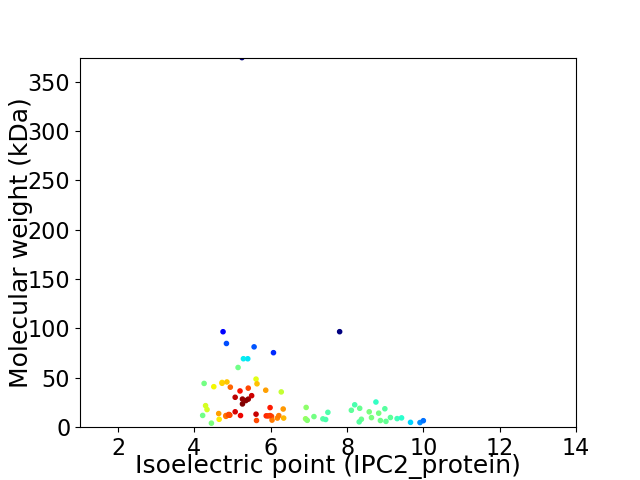
Virtual 2D-PAGE plot for 78 proteins (isoelectric point calculated using IPC2_protein)
Get csv file with sequences according to given criteria:
* You can choose from 21 different methods for calculating isoelectric point
Summary statistics related to proteome-wise predictions


Protein with the lowest isoelectric point:
>tr|A0A2Z4PZX7|A0A2Z4PZX7_9CAUD Uncharacterized protein OS=Escherichia phage phi G17 OX=2234086 PE=4 SV=1
MM1 pKa = 6.64PTVYY5 pKa = 10.34VSAQQSTKK13 pKa = 10.07KK14 pKa = 10.13INYY17 pKa = 6.42STSPSMEE24 pKa = 4.66DD25 pKa = 3.08GFVAIGSFEE34 pKa = 4.71HH35 pKa = 7.56PDD37 pKa = 2.93ATYY40 pKa = 10.4PDD42 pKa = 4.99SYY44 pKa = 11.05VIWHH48 pKa = 7.52GIRR51 pKa = 11.84KK52 pKa = 8.63IAYY55 pKa = 7.59FRR57 pKa = 11.84NGGNVAQTAFFPDD70 pKa = 3.51NLTNLNDD77 pKa = 3.35WDD79 pKa = 3.73IYY81 pKa = 10.51EE82 pKa = 4.49VVPGSDD88 pKa = 3.55PVPVGFDD95 pKa = 2.97VYY97 pKa = 10.66RR98 pKa = 11.84YY99 pKa = 10.22DD100 pKa = 4.21PEE102 pKa = 4.11TEE104 pKa = 4.25EE105 pKa = 5.05ISRR108 pKa = 11.84LYY110 pKa = 10.55QDD112 pKa = 5.09GEE114 pKa = 4.26TLDD117 pKa = 3.61VYY119 pKa = 11.13EE120 pKa = 4.29GVRR123 pKa = 11.84YY124 pKa = 9.84LRR126 pKa = 11.84VVPKK130 pKa = 8.9PTGSTGTITLAVEE143 pKa = 4.49GEE145 pKa = 3.97AAASYY150 pKa = 9.97DD151 pKa = 3.33IKK153 pKa = 11.21LEE155 pKa = 3.86PTLGYY160 pKa = 10.86GVISYY165 pKa = 9.83KK166 pKa = 10.19WGTEE170 pKa = 3.88PSPGVYY176 pKa = 9.91DD177 pKa = 4.37AEE179 pKa = 4.18LTITKK184 pKa = 10.22DD185 pKa = 3.6GVSTTLQLAYY195 pKa = 10.5SALL198 pKa = 3.77
MM1 pKa = 6.64PTVYY5 pKa = 10.34VSAQQSTKK13 pKa = 10.07KK14 pKa = 10.13INYY17 pKa = 6.42STSPSMEE24 pKa = 4.66DD25 pKa = 3.08GFVAIGSFEE34 pKa = 4.71HH35 pKa = 7.56PDD37 pKa = 2.93ATYY40 pKa = 10.4PDD42 pKa = 4.99SYY44 pKa = 11.05VIWHH48 pKa = 7.52GIRR51 pKa = 11.84KK52 pKa = 8.63IAYY55 pKa = 7.59FRR57 pKa = 11.84NGGNVAQTAFFPDD70 pKa = 3.51NLTNLNDD77 pKa = 3.35WDD79 pKa = 3.73IYY81 pKa = 10.51EE82 pKa = 4.49VVPGSDD88 pKa = 3.55PVPVGFDD95 pKa = 2.97VYY97 pKa = 10.66RR98 pKa = 11.84YY99 pKa = 10.22DD100 pKa = 4.21PEE102 pKa = 4.11TEE104 pKa = 4.25EE105 pKa = 5.05ISRR108 pKa = 11.84LYY110 pKa = 10.55QDD112 pKa = 5.09GEE114 pKa = 4.26TLDD117 pKa = 3.61VYY119 pKa = 11.13EE120 pKa = 4.29GVRR123 pKa = 11.84YY124 pKa = 9.84LRR126 pKa = 11.84VVPKK130 pKa = 8.9PTGSTGTITLAVEE143 pKa = 4.49GEE145 pKa = 3.97AAASYY150 pKa = 9.97DD151 pKa = 3.33IKK153 pKa = 11.21LEE155 pKa = 3.86PTLGYY160 pKa = 10.86GVISYY165 pKa = 9.83KK166 pKa = 10.19WGTEE170 pKa = 3.88PSPGVYY176 pKa = 9.91DD177 pKa = 4.37AEE179 pKa = 4.18LTITKK184 pKa = 10.22DD185 pKa = 3.6GVSTTLQLAYY195 pKa = 10.5SALL198 pKa = 3.77
Molecular weight: 21.82 kDa
Isoelectric point according different methods:
Protein with the highest isoelectric point:
>tr|A0A2Z4PZY8|A0A2Z4PZY8_9CAUD Uncharacterized protein OS=Escherichia phage phi G17 OX=2234086 PE=4 SV=1
MM1 pKa = 7.08NLKK4 pKa = 10.4LFMMFEE10 pKa = 4.81GGVSTQEE17 pKa = 3.49IFNPRR22 pKa = 11.84WGLMSRR28 pKa = 11.84NKK30 pKa = 7.89VTVYY34 pKa = 9.57FRR36 pKa = 11.84PVRR39 pKa = 3.72
MM1 pKa = 7.08NLKK4 pKa = 10.4LFMMFEE10 pKa = 4.81GGVSTQEE17 pKa = 3.49IFNPRR22 pKa = 11.84WGLMSRR28 pKa = 11.84NKK30 pKa = 7.89VTVYY34 pKa = 9.57FRR36 pKa = 11.84PVRR39 pKa = 3.72
Molecular weight: 4.68 kDa
Isoelectric point according different methods:
Peptides (in silico digests for buttom-up proteomics)
Below you can find in silico digests of the whole proteome with Trypsin, Chymotrypsin, Trypsin+LysC, LysN, ArgC proteases suitable for different mass spec machines.| Try ESI |
 |
|---|
| ChTry ESI |
 |
|---|
| ArgC ESI |
 |
|---|
| LysN ESI |
 |
|---|
| TryLysC ESI |
 |
|---|
| Try MALDI |
 |
|---|
| ChTry MALDI |
 |
|---|
| ArgC MALDI |
 |
|---|
| LysN MALDI |
 |
|---|
| TryLysC MALDI |
 |
|---|
| Try LTQ |
 |
|---|
| ChTry LTQ |
 |
|---|
| ArgC LTQ |
 |
|---|
| LysN LTQ |
 |
|---|
| TryLysC LTQ |
 |
|---|
| Try MSlow |
 |
|---|
| ChTry MSlow |
 |
|---|
| ArgC MSlow |
 |
|---|
| LysN MSlow |
 |
|---|
| TryLysC MSlow |
 |
|---|
| Try MShigh |
 |
|---|
| ChTry MShigh |
 |
|---|
| ArgC MShigh |
 |
|---|
| LysN MShigh |
 |
|---|
| TryLysC MShigh |
 |
|---|
General Statistics
Number of major isoforms |
Number of additional isoforms |
Number of all proteins |
Number of amino acids |
Min. Seq. Length |
Max. Seq. Length |
Avg. Seq. Length |
Avg. Mol. Weight |
|---|---|---|---|---|---|---|---|
0 |
20545 |
37 |
3450 |
263.4 |
29.37 |
Amino acid frequency
Ala |
Cys |
Asp |
Glu |
Phe |
Gly |
His |
Ile |
Lys |
Leu |
|---|---|---|---|---|---|---|---|---|---|
8.542 ± 0.682 | 0.862 ± 0.17 |
5.807 ± 0.163 | 6.663 ± 0.257 |
3.66 ± 0.197 | 6.659 ± 0.241 |
1.665 ± 0.156 | 5.505 ± 0.265 |
6.323 ± 0.257 | 8.304 ± 0.221 |
Met |
Asn |
Gln |
Pro |
Arg |
Ser |
Thr |
Val |
Trp |
Tyr |
|---|---|---|---|---|---|---|---|---|---|
3.11 ± 0.148 | 5.578 ± 0.191 |
4.079 ± 0.172 | 4.347 ± 0.307 |
4.332 ± 0.169 | 6.225 ± 0.193 |
6.483 ± 0.289 | 6.8 ± 0.258 |
1.197 ± 0.117 | 3.86 ± 0.313 |
Most of the basic statistics you can see at this page can be downloaded from this CSV file
Proteome-pI is available under Creative Commons Attribution-NoDerivs license, for more details see here
| Reference: Kozlowski LP. Proteome-pI 2.0: Proteome Isoelectric Point Database Update. Nucleic Acids Res. 2021, doi: 10.1093/nar/gkab944 | Contact: Lukasz P. Kozlowski |
