Microbacterium phage Min1
Taxonomy: Viruses; Duplodnaviria; Heunggongvirae; Uroviricota; Caudoviricetes; Caudovirales; Siphoviridae; Minunavirus; Microbacterium virus Min1
Average proteome isoelectric point is 6.36
Get precalculated fractions of proteins

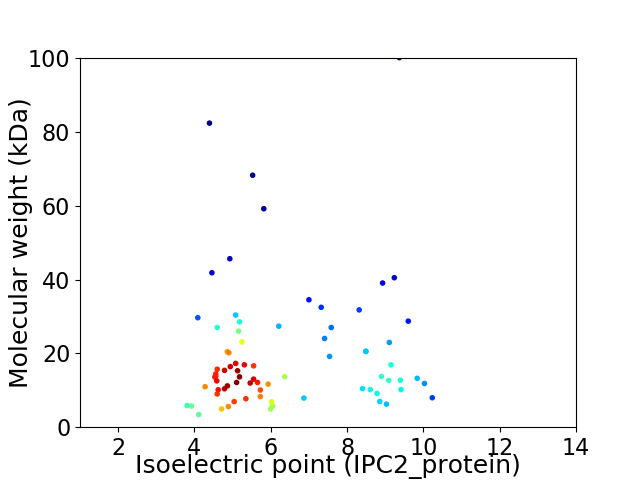
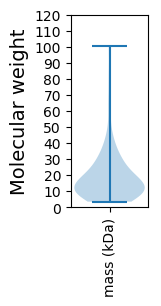
Virtual 2D-PAGE plot for 77 proteins (isoelectric point calculated using IPC2_protein)
Get csv file with sequences according to given criteria:
* You can choose from 21 different methods for calculating isoelectric point
Summary statistics related to proteome-wise predictions


Protein with the lowest isoelectric point:
>tr|A6N234|A6N234_9CAUD Uncharacterized protein OS=Microbacterium phage Min1 OX=446529 PE=4 SV=1
MM1 pKa = 7.78TDD3 pKa = 3.71LSSPEE8 pKa = 3.88YY9 pKa = 10.72GAATCASCGVVLRR22 pKa = 11.84DD23 pKa = 3.72DD24 pKa = 4.21EE25 pKa = 5.53GGLRR29 pKa = 11.84CPSCGTIILAPVVVQPVFDD48 pKa = 5.15GPDD51 pKa = 3.14IDD53 pKa = 4.4DD54 pKa = 3.4WRR56 pKa = 5.79
MM1 pKa = 7.78TDD3 pKa = 3.71LSSPEE8 pKa = 3.88YY9 pKa = 10.72GAATCASCGVVLRR22 pKa = 11.84DD23 pKa = 3.72DD24 pKa = 4.21EE25 pKa = 5.53GGLRR29 pKa = 11.84CPSCGTIILAPVVVQPVFDD48 pKa = 5.15GPDD51 pKa = 3.14IDD53 pKa = 4.4DD54 pKa = 3.4WRR56 pKa = 5.79
Molecular weight: 5.87 kDa
Isoelectric point according different methods:
Protein with the highest isoelectric point:
>tr|A6N1W0|A6N1W0_9CAUD Probable c1 repressor OS=Microbacterium phage Min1 OX=446529 PE=4 SV=1
MM1 pKa = 7.3YY2 pKa = 10.83GFFTWMQEE10 pKa = 3.85EE11 pKa = 4.86EE12 pKa = 4.24FRR14 pKa = 11.84LDD16 pKa = 3.13NPAARR21 pKa = 11.84LPKK24 pKa = 9.68VRR26 pKa = 11.84VPKK29 pKa = 10.54VEE31 pKa = 4.33PDD33 pKa = 3.34PVTTEE38 pKa = 4.49DD39 pKa = 3.64IEE41 pKa = 4.71LVLHH45 pKa = 5.78SGIYY49 pKa = 9.63RR50 pKa = 11.84RR51 pKa = 11.84TRR53 pKa = 11.84MWVLLYY59 pKa = 10.32AYY61 pKa = 9.91QGMRR65 pKa = 11.84AAEE68 pKa = 3.96IAAVSGSSIDD78 pKa = 3.13WKK80 pKa = 10.84ARR82 pKa = 11.84RR83 pKa = 11.84ILSIEE88 pKa = 3.83AKK90 pKa = 10.01GGKK93 pKa = 7.85EE94 pKa = 3.69VWRR97 pKa = 11.84PLHH100 pKa = 5.35PVVWEE105 pKa = 4.03QLQTWHH111 pKa = 5.03TTGWLFPSPTRR122 pKa = 11.84KK123 pKa = 10.06GEE125 pKa = 4.01HH126 pKa = 3.99VTAANVSNVLSKK138 pKa = 10.53AFKK141 pKa = 9.94RR142 pKa = 11.84AGVAHH147 pKa = 7.48RR148 pKa = 11.84PHH150 pKa = 7.42QMRR153 pKa = 11.84AWFATEE159 pKa = 4.37MIAAGTPTIVVAAAMRR175 pKa = 11.84HH176 pKa = 5.8SDD178 pKa = 3.41TQSVEE183 pKa = 3.67KK184 pKa = 10.26YY185 pKa = 9.92VRR187 pKa = 11.84VRR189 pKa = 11.84DD190 pKa = 4.1DD191 pKa = 4.39KK192 pKa = 11.19IAEE195 pKa = 4.21AMLALPRR202 pKa = 11.84FQIPSRR208 pKa = 11.84SGRR211 pKa = 11.84RR212 pKa = 11.84VALAKK217 pKa = 9.68PASVAQGIEE226 pKa = 3.85QRR228 pKa = 11.84PSNSRR233 pKa = 11.84VDD235 pKa = 3.54GSNPSGGTRR244 pKa = 11.84RR245 pKa = 11.84TARR248 pKa = 11.84QQQGDD253 pKa = 3.46RR254 pKa = 11.84AAA256 pKa = 4.18
MM1 pKa = 7.3YY2 pKa = 10.83GFFTWMQEE10 pKa = 3.85EE11 pKa = 4.86EE12 pKa = 4.24FRR14 pKa = 11.84LDD16 pKa = 3.13NPAARR21 pKa = 11.84LPKK24 pKa = 9.68VRR26 pKa = 11.84VPKK29 pKa = 10.54VEE31 pKa = 4.33PDD33 pKa = 3.34PVTTEE38 pKa = 4.49DD39 pKa = 3.64IEE41 pKa = 4.71LVLHH45 pKa = 5.78SGIYY49 pKa = 9.63RR50 pKa = 11.84RR51 pKa = 11.84TRR53 pKa = 11.84MWVLLYY59 pKa = 10.32AYY61 pKa = 9.91QGMRR65 pKa = 11.84AAEE68 pKa = 3.96IAAVSGSSIDD78 pKa = 3.13WKK80 pKa = 10.84ARR82 pKa = 11.84RR83 pKa = 11.84ILSIEE88 pKa = 3.83AKK90 pKa = 10.01GGKK93 pKa = 7.85EE94 pKa = 3.69VWRR97 pKa = 11.84PLHH100 pKa = 5.35PVVWEE105 pKa = 4.03QLQTWHH111 pKa = 5.03TTGWLFPSPTRR122 pKa = 11.84KK123 pKa = 10.06GEE125 pKa = 4.01HH126 pKa = 3.99VTAANVSNVLSKK138 pKa = 10.53AFKK141 pKa = 9.94RR142 pKa = 11.84AGVAHH147 pKa = 7.48RR148 pKa = 11.84PHH150 pKa = 7.42QMRR153 pKa = 11.84AWFATEE159 pKa = 4.37MIAAGTPTIVVAAAMRR175 pKa = 11.84HH176 pKa = 5.8SDD178 pKa = 3.41TQSVEE183 pKa = 3.67KK184 pKa = 10.26YY185 pKa = 9.92VRR187 pKa = 11.84VRR189 pKa = 11.84DD190 pKa = 4.1DD191 pKa = 4.39KK192 pKa = 11.19IAEE195 pKa = 4.21AMLALPRR202 pKa = 11.84FQIPSRR208 pKa = 11.84SGRR211 pKa = 11.84RR212 pKa = 11.84VALAKK217 pKa = 9.68PASVAQGIEE226 pKa = 3.85QRR228 pKa = 11.84PSNSRR233 pKa = 11.84VDD235 pKa = 3.54GSNPSGGTRR244 pKa = 11.84RR245 pKa = 11.84TARR248 pKa = 11.84QQQGDD253 pKa = 3.46RR254 pKa = 11.84AAA256 pKa = 4.18
Molecular weight: 28.75 kDa
Isoelectric point according different methods:
Peptides (in silico digests for buttom-up proteomics)
Below you can find in silico digests of the whole proteome with Trypsin, Chymotrypsin, Trypsin+LysC, LysN, ArgC proteases suitable for different mass spec machines.| Try ESI |
 |
|---|
| ChTry ESI |
 |
|---|
| ArgC ESI |
 |
|---|
| LysN ESI |
 |
|---|
| TryLysC ESI |
 |
|---|
| Try MALDI |
 |
|---|
| ChTry MALDI |
 |
|---|
| ArgC MALDI |
 |
|---|
| LysN MALDI |
 |
|---|
| TryLysC MALDI |
 |
|---|
| Try LTQ |
 |
|---|
| ChTry LTQ |
 |
|---|
| ArgC LTQ |
 |
|---|
| LysN LTQ |
 |
|---|
| TryLysC LTQ |
 |
|---|
| Try MSlow |
 |
|---|
| ChTry MSlow |
 |
|---|
| ArgC MSlow |
 |
|---|
| LysN MSlow |
 |
|---|
| TryLysC MSlow |
 |
|---|
| Try MShigh |
 |
|---|
| ChTry MShigh |
 |
|---|
| ArgC MShigh |
 |
|---|
| LysN MShigh |
 |
|---|
| TryLysC MShigh |
 |
|---|
General Statistics
Number of major isoforms |
Number of additional isoforms |
Number of all proteins |
Number of amino acids |
Min. Seq. Length |
Max. Seq. Length |
Avg. Seq. Length |
Avg. Mol. Weight |
|---|---|---|---|---|---|---|---|
0 |
14028 |
34 |
1010 |
182.2 |
19.64 |
Amino acid frequency
Ala |
Cys |
Asp |
Glu |
Phe |
Gly |
His |
Ile |
Lys |
Leu |
|---|---|---|---|---|---|---|---|---|---|
13.459 ± 0.547 | 0.834 ± 0.132 |
6.352 ± 0.36 | 6.309 ± 0.344 |
2.246 ± 0.166 | 8.975 ± 0.454 |
2.103 ± 0.23 | 3.999 ± 0.215 |
2.395 ± 0.202 | 8.533 ± 0.373 |
Met |
Asn |
Gln |
Pro |
Arg |
Ser |
Thr |
Val |
Trp |
Tyr |
|---|---|---|---|---|---|---|---|---|---|
1.775 ± 0.107 | 1.932 ± 0.146 |
5.66 ± 0.301 | 3.058 ± 0.176 |
8.576 ± 0.449 | 5.375 ± 0.361 |
6.337 ± 0.308 | 8.312 ± 0.326 |
1.925 ± 0.176 | 1.846 ± 0.177 |
Most of the basic statistics you can see at this page can be downloaded from this CSV file
Proteome-pI is available under Creative Commons Attribution-NoDerivs license, for more details see here
| Reference: Kozlowski LP. Proteome-pI 2.0: Proteome Isoelectric Point Database Update. Nucleic Acids Res. 2021, doi: 10.1093/nar/gkab944 | Contact: Lukasz P. Kozlowski |
