Pseudomonas phage UFV-P2
Taxonomy: Viruses; Duplodnaviria; Heunggongvirae; Uroviricota; Caudoviricetes; Caudovirales; Podoviridae; Vicosavirus; Pseudomonas virus UFVP2
Average proteome isoelectric point is 6.53
Get precalculated fractions of proteins
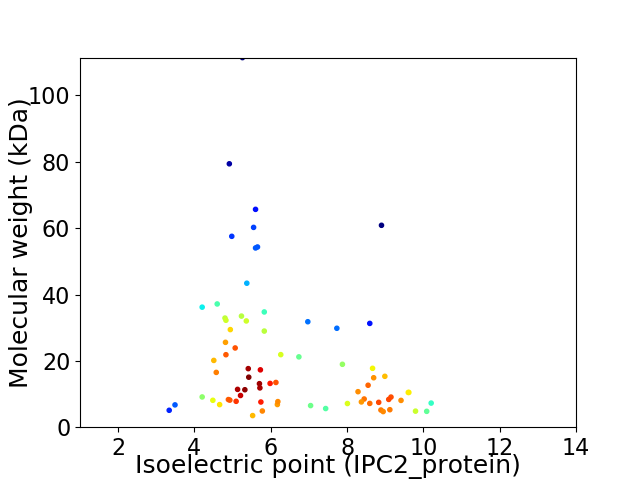
Virtual 2D-PAGE plot for 75 proteins (isoelectric point calculated using IPC2_protein)
Get csv file with sequences according to given criteria:
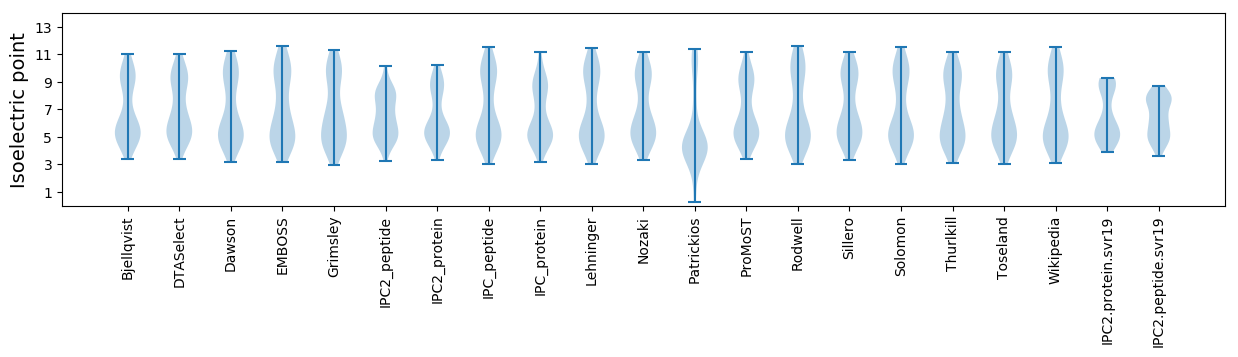
* You can choose from 21 different methods for calculating isoelectric point
Summary statistics related to proteome-wise predictions
Protein with the lowest isoelectric point:
>tr|M4T216|M4T216_9CAUD Uncharacterized protein OS=Pseudomonas phage UFV-P2 OX=1235661 PE=4 SV=1
MM1 pKa = 7.68GNPVLKK7 pKa = 10.59SVVTGVVVAEE17 pKa = 3.97TLEE20 pKa = 4.21FSRR23 pKa = 11.84GQMWADD29 pKa = 3.36EE30 pKa = 4.28KK31 pKa = 11.42GQVLLCTDD39 pKa = 3.87EE40 pKa = 3.9QTMVVIADD48 pKa = 4.23KK49 pKa = 11.29LPGNIGTIYY58 pKa = 10.57NFYY61 pKa = 11.04DD62 pKa = 3.06VGEE65 pKa = 4.71LYY67 pKa = 11.07NEE69 pKa = 5.2GYY71 pKa = 10.46SLQTALSVTLTVSS84 pKa = 3.14
MM1 pKa = 7.68GNPVLKK7 pKa = 10.59SVVTGVVVAEE17 pKa = 3.97TLEE20 pKa = 4.21FSRR23 pKa = 11.84GQMWADD29 pKa = 3.36EE30 pKa = 4.28KK31 pKa = 11.42GQVLLCTDD39 pKa = 3.87EE40 pKa = 3.9QTMVVIADD48 pKa = 4.23KK49 pKa = 11.29LPGNIGTIYY58 pKa = 10.57NFYY61 pKa = 11.04DD62 pKa = 3.06VGEE65 pKa = 4.71LYY67 pKa = 11.07NEE69 pKa = 5.2GYY71 pKa = 10.46SLQTALSVTLTVSS84 pKa = 3.14
Molecular weight: 9.12 kDa
Isoelectric point according different methods:
Protein with the highest isoelectric point:
>tr|M4T221|M4T221_9CAUD Uncharacterized protein OS=Pseudomonas phage UFV-P2 OX=1235661 PE=4 SV=1
MM1 pKa = 7.38RR2 pKa = 11.84KK3 pKa = 9.57ARR5 pKa = 11.84VFYY8 pKa = 10.12EE9 pKa = 4.41IIDD12 pKa = 3.78PTGDD16 pKa = 3.36LTLSGARR23 pKa = 11.84YY24 pKa = 9.02KK25 pKa = 10.53ARR27 pKa = 11.84KK28 pKa = 8.43VMRR31 pKa = 11.84PKK33 pKa = 10.38SRR35 pKa = 11.84KK36 pKa = 9.03AALAQSS42 pKa = 3.75
MM1 pKa = 7.38RR2 pKa = 11.84KK3 pKa = 9.57ARR5 pKa = 11.84VFYY8 pKa = 10.12EE9 pKa = 4.41IIDD12 pKa = 3.78PTGDD16 pKa = 3.36LTLSGARR23 pKa = 11.84YY24 pKa = 9.02KK25 pKa = 10.53ARR27 pKa = 11.84KK28 pKa = 8.43VMRR31 pKa = 11.84PKK33 pKa = 10.38SRR35 pKa = 11.84KK36 pKa = 9.03AALAQSS42 pKa = 3.75
Molecular weight: 4.78 kDa
Isoelectric point according different methods:
Peptides (in silico digests for buttom-up proteomics)
Below you can find in silico digests of the whole proteome with Trypsin, Chymotrypsin, Trypsin+LysC, LysN, ArgC proteases suitable for different mass spec machines.| Try ESI |
 |
|---|
| ChTry ESI |
|
|---|
| ArgC ESI |
|
|---|
| LysN ESI |
|
|---|
| TryLysC ESI |
|
|---|
| Try MALDI |
|
|---|
| ChTry MALDI |
|
|---|
| ArgC MALDI |
|
|---|
| LysN MALDI |
|
|---|
| TryLysC MALDI |
|
|---|
| Try LTQ |
|
|---|
| ChTry LTQ |
|
|---|
| ArgC LTQ |
|
|---|
| LysN LTQ |
|
|---|
| TryLysC LTQ |
|
|---|
| Try MSlow |
|
|---|
| ChTry MSlow |
|
|---|
| ArgC MSlow |
|
|---|
| LysN MSlow |
|
|---|
| TryLysC MSlow |
|
|---|
| Try MShigh |
|
|---|
| ChTry MShigh |
|
|---|
| ArgC MShigh |
|
|---|
| LysN MShigh |
|
|---|
| TryLysC MShigh |
|
|---|
General Statistics
Number of major isoforms |
Number of additional isoforms |
Number of all proteins |
Number of amino acids |
Min. Seq. Length |
Max. Seq. Length |
Avg. Seq. Length |
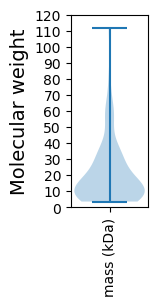
Avg. Mol. Weight |
|---|---|---|---|---|---|---|---|
0 |
14154 |
34 |
1054 |
188.7 |
20.95 |
Amino acid frequency
Ala |
Cys |
Asp |
Glu |
Phe |
Gly |
His |
Ile |
Lys |
Leu |
|---|---|---|---|---|---|---|---|---|---|
8.69 ± 0.647 | 1.053 ± 0.145 |
6.111 ± 0.215 | 6.45 ± 0.328 |
3.801 ± 0.249 | 8.351 ± 0.359 |
1.809 ± 0.213 | 4.825 ± 0.238 |
5.991 ± 0.273 | 8.252 ± 0.259 |
Met |
Asn |
Gln |
Pro |
Arg |
Ser |
Thr |
Val |
Trp |
Tyr |
|---|---|---|---|---|---|---|---|---|---|
2.89 ± 0.14 | 4.797 ± 0.208 |
4.5 ± 0.263 | 4.281 ± 0.291 |
5.193 ± 0.22 | 5.278 ± 0.266 |
5.666 ± 0.258 | 7.199 ± 0.258 |
1.611 ± 0.154 | 3.25 ± 0.213 |
Most of the basic statistics you can see at this page can be downloaded from this CSV file
See this proteome in:

Proteome-pI is available under Creative Commons Attribution-NoDerivs license, for more details see here
| Reference: Kozlowski LP. Proteome-pI 2.0: Proteome Isoelectric Point Database Update. Nucleic Acids Res. 2021, doi: 10.1093/nar/gkab944 | Contact: Lukasz P. Kozlowski |