Melioribacter roseus (strain JCM 17771 / P3M-2)
Taxonomy: cellular organisms; Bacteria; FCB group; Bacteroidetes/Chlorobi group; Ignavibacteriae; Ignavibacteria; Ignavibacteriales; Melioribacteraceae; Melioribacter; Melioribacter roseus
Average proteome isoelectric point is 6.48
Get precalculated fractions of proteins
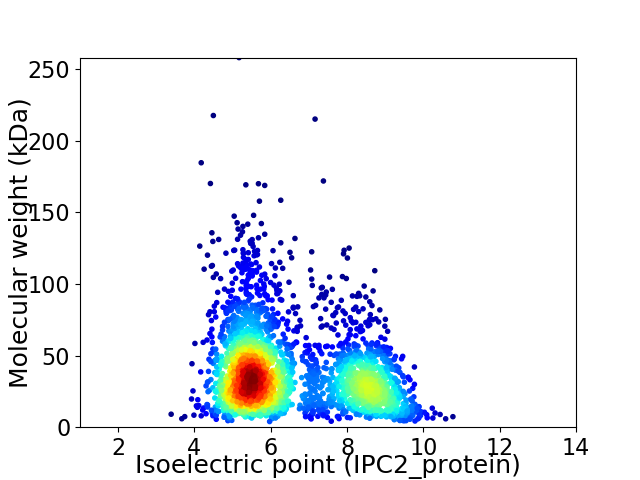
Virtual 2D-PAGE plot for 2833 proteins (isoelectric point calculated using IPC2_protein)
Get csv file with sequences according to given criteria:
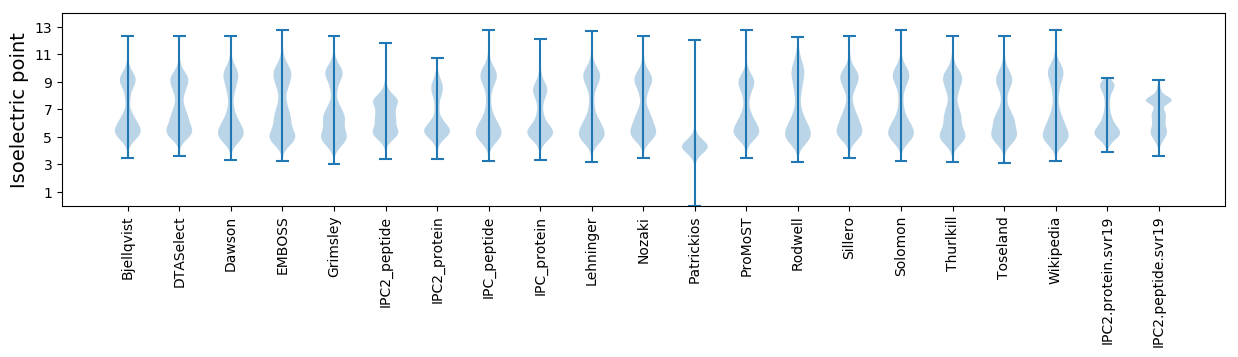
* You can choose from 21 different methods for calculating isoelectric point
Summary statistics related to proteome-wise predictions
Protein with the lowest isoelectric point:
>tr|I7A7Y2|I7A7Y2_MELRP PSCyt1 domain-containing protein OS=Melioribacter roseus (strain JCM 17771 / P3M-2) OX=1191523 GN=MROS_2746 PE=4 SV=1
MM1 pKa = 7.32KK2 pKa = 10.4AFYY5 pKa = 10.16KK6 pKa = 10.42IFAILILSYY15 pKa = 11.11GFIAAQEE22 pKa = 4.13LSVGADD28 pKa = 3.17VVSRR32 pKa = 11.84YY33 pKa = 7.17IWRR36 pKa = 11.84GADD39 pKa = 3.19LGNNNPSIQPTIEE52 pKa = 3.95LSSGGFAAGFWGAYY66 pKa = 8.66PMSDD70 pKa = 2.92PAGLNEE76 pKa = 3.7IDD78 pKa = 5.19FYY80 pKa = 11.79ASYY83 pKa = 11.09SFSLGKK89 pKa = 10.58AGDD92 pKa = 3.75LSIGFTDD99 pKa = 3.48YY100 pKa = 10.87MNPNSGTKK108 pKa = 9.44IGNFNNYY115 pKa = 9.59DD116 pKa = 3.65DD117 pKa = 5.68AEE119 pKa = 4.75GPGAHH124 pKa = 7.08FIEE127 pKa = 5.19LNVGYY132 pKa = 9.83GGSEE136 pKa = 4.06SFPVSISFNYY146 pKa = 9.76FLYY149 pKa = 10.67NVEE152 pKa = 4.21NNPIYY157 pKa = 11.03VEE159 pKa = 4.37LGYY162 pKa = 9.0STSVKK167 pKa = 10.43DD168 pKa = 3.59VSLDD172 pKa = 3.51LFLGATPGEE181 pKa = 4.07DD182 pKa = 2.77ALYY185 pKa = 10.93YY186 pKa = 10.11GTDD189 pKa = 3.0SFNIINLGITAGKK202 pKa = 9.25SIKK205 pKa = 10.23ISDD208 pKa = 3.93SFEE211 pKa = 4.39LPVFGSVILNPATEE225 pKa = 4.24DD226 pKa = 3.16LFYY229 pKa = 11.27VIGISLL235 pKa = 3.62
MM1 pKa = 7.32KK2 pKa = 10.4AFYY5 pKa = 10.16KK6 pKa = 10.42IFAILILSYY15 pKa = 11.11GFIAAQEE22 pKa = 4.13LSVGADD28 pKa = 3.17VVSRR32 pKa = 11.84YY33 pKa = 7.17IWRR36 pKa = 11.84GADD39 pKa = 3.19LGNNNPSIQPTIEE52 pKa = 3.95LSSGGFAAGFWGAYY66 pKa = 8.66PMSDD70 pKa = 2.92PAGLNEE76 pKa = 3.7IDD78 pKa = 5.19FYY80 pKa = 11.79ASYY83 pKa = 11.09SFSLGKK89 pKa = 10.58AGDD92 pKa = 3.75LSIGFTDD99 pKa = 3.48YY100 pKa = 10.87MNPNSGTKK108 pKa = 9.44IGNFNNYY115 pKa = 9.59DD116 pKa = 3.65DD117 pKa = 5.68AEE119 pKa = 4.75GPGAHH124 pKa = 7.08FIEE127 pKa = 5.19LNVGYY132 pKa = 9.83GGSEE136 pKa = 4.06SFPVSISFNYY146 pKa = 9.76FLYY149 pKa = 10.67NVEE152 pKa = 4.21NNPIYY157 pKa = 11.03VEE159 pKa = 4.37LGYY162 pKa = 9.0STSVKK167 pKa = 10.43DD168 pKa = 3.59VSLDD172 pKa = 3.51LFLGATPGEE181 pKa = 4.07DD182 pKa = 2.77ALYY185 pKa = 10.93YY186 pKa = 10.11GTDD189 pKa = 3.0SFNIINLGITAGKK202 pKa = 9.25SIKK205 pKa = 10.23ISDD208 pKa = 3.93SFEE211 pKa = 4.39LPVFGSVILNPATEE225 pKa = 4.24DD226 pKa = 3.16LFYY229 pKa = 11.27VIGISLL235 pKa = 3.62
Molecular weight: 25.32 kDa
Isoelectric point according different methods:
Protein with the highest isoelectric point:
>tr|I6Z307|I6Z307_MELRP ATP synthase gamma chain OS=Melioribacter roseus (strain JCM 17771 / P3M-2) OX=1191523 GN=atpG PE=3 SV=1
MM1 pKa = 6.76VRR3 pKa = 11.84KK4 pKa = 9.68GRR6 pKa = 11.84EE7 pKa = 3.77VVTSKK12 pKa = 11.13NKK14 pKa = 10.28APALEE19 pKa = 4.41ACPQKK24 pKa = 10.67RR25 pKa = 11.84GVCTRR30 pKa = 11.84VYY32 pKa = 7.93TTTPKK37 pKa = 10.54KK38 pKa = 10.26PNSALRR44 pKa = 11.84KK45 pKa = 7.18VARR48 pKa = 11.84VRR50 pKa = 11.84LSNGIEE56 pKa = 3.8VTAYY60 pKa = 9.84IPGEE64 pKa = 3.86GHH66 pKa = 6.47NLQEE70 pKa = 4.15HH71 pKa = 6.65SIVLIRR77 pKa = 11.84GGRR80 pKa = 11.84VKK82 pKa = 10.7DD83 pKa = 3.73LPGVRR88 pKa = 11.84YY89 pKa = 9.5HH90 pKa = 7.64IIRR93 pKa = 11.84GTLDD97 pKa = 3.03TSGVEE102 pKa = 3.94DD103 pKa = 3.93RR104 pKa = 11.84KK105 pKa = 10.55QGRR108 pKa = 11.84SKK110 pKa = 11.3YY111 pKa = 8.24GTKK114 pKa = 10.06KK115 pKa = 10.32PKK117 pKa = 10.59AKK119 pKa = 10.49
MM1 pKa = 6.76VRR3 pKa = 11.84KK4 pKa = 9.68GRR6 pKa = 11.84EE7 pKa = 3.77VVTSKK12 pKa = 11.13NKK14 pKa = 10.28APALEE19 pKa = 4.41ACPQKK24 pKa = 10.67RR25 pKa = 11.84GVCTRR30 pKa = 11.84VYY32 pKa = 7.93TTTPKK37 pKa = 10.54KK38 pKa = 10.26PNSALRR44 pKa = 11.84KK45 pKa = 7.18VARR48 pKa = 11.84VRR50 pKa = 11.84LSNGIEE56 pKa = 3.8VTAYY60 pKa = 9.84IPGEE64 pKa = 3.86GHH66 pKa = 6.47NLQEE70 pKa = 4.15HH71 pKa = 6.65SIVLIRR77 pKa = 11.84GGRR80 pKa = 11.84VKK82 pKa = 10.7DD83 pKa = 3.73LPGVRR88 pKa = 11.84YY89 pKa = 9.5HH90 pKa = 7.64IIRR93 pKa = 11.84GTLDD97 pKa = 3.03TSGVEE102 pKa = 3.94DD103 pKa = 3.93RR104 pKa = 11.84KK105 pKa = 10.55QGRR108 pKa = 11.84SKK110 pKa = 11.3YY111 pKa = 8.24GTKK114 pKa = 10.06KK115 pKa = 10.32PKK117 pKa = 10.59AKK119 pKa = 10.49
Molecular weight: 13.16 kDa
Isoelectric point according different methods:
Peptides (in silico digests for buttom-up proteomics)
Below you can find in silico digests of the whole proteome with Trypsin, Chymotrypsin, Trypsin+LysC, LysN, ArgC proteases suitable for different mass spec machines.| Try ESI |
 |
|---|
| ChTry ESI |
|
|---|
| ArgC ESI |
|
|---|
| LysN ESI |
|
|---|
| TryLysC ESI |
|
|---|
| Try MALDI |
|
|---|
| ChTry MALDI |
|
|---|
| ArgC MALDI |
|
|---|
| LysN MALDI |
|
|---|
| TryLysC MALDI |
|
|---|
| Try LTQ |
|
|---|
| ChTry LTQ |
|
|---|
| ArgC LTQ |
|
|---|
| LysN LTQ |
|
|---|
| TryLysC LTQ |
|
|---|
| Try MSlow |
|
|---|
| ChTry MSlow |
|
|---|
| ArgC MSlow |
|
|---|
| LysN MSlow |
|
|---|
| TryLysC MSlow |
|
|---|
| Try MShigh |
|
|---|
| ChTry MShigh |
|
|---|
| ArgC MShigh |
|
|---|
| LysN MShigh |
|
|---|
| TryLysC MShigh |
|
|---|
General Statistics
Number of major isoforms |
Number of additional isoforms |
Number of all proteins |
Number of amino acids |
Min. Seq. Length |
Max. Seq. Length |
Avg. Seq. Length |
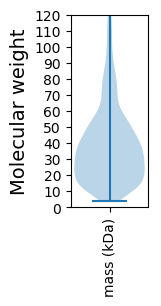
Avg. Mol. Weight |
|---|---|---|---|---|---|---|---|
0 |
1007411 |
37 |
2275 |
355.6 |
40.22 |
Amino acid frequency
Ala |
Cys |
Asp |
Glu |
Phe |
Gly |
His |
Ile |
Lys |
Leu |
|---|---|---|---|---|---|---|---|---|---|
6.456 ± 0.038 | 0.73 ± 0.017 |
5.592 ± 0.032 | 7.165 ± 0.054 |
5.027 ± 0.032 | 6.636 ± 0.04 |
1.524 ± 0.016 | 8.618 ± 0.043 |
7.849 ± 0.047 | 9.361 ± 0.042 |
Met |
Asn |
Gln |
Pro |
Arg |
Ser |
Thr |
Val |
Trp |
Tyr |
|---|---|---|---|---|---|---|---|---|---|
2.068 ± 0.019 | 5.785 ± 0.042 |
3.692 ± 0.028 | 2.484 ± 0.021 |
4.171 ± 0.029 | 6.264 ± 0.033 |
4.891 ± 0.035 | 6.18 ± 0.036 |
1.056 ± 0.017 | 4.452 ± 0.034 |
Most of the basic statistics you can see at this page can be downloaded from this CSV file
See this proteome in:

Proteome-pI is available under Creative Commons Attribution-NoDerivs license, for more details see here
| Reference: Kozlowski LP. Proteome-pI 2.0: Proteome Isoelectric Point Database Update. Nucleic Acids Res. 2021, doi: 10.1093/nar/gkab944 | Contact: Lukasz P. Kozlowski |