Geobacter sp. DSM 9736
Taxonomy: cellular organisms; Bacteria; Proteobacteria; delta/epsilon subdivisions; Deltaproteobacteria; Desulfuromonadales; Geobacteraceae; Geobacter; unclassified Geobacter
Average proteome isoelectric point is 6.64
Get precalculated fractions of proteins
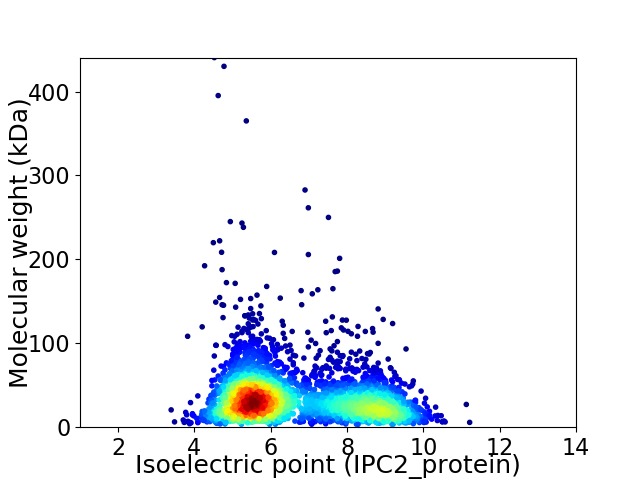
Virtual 2D-PAGE plot for 3513 proteins (isoelectric point calculated using IPC2_protein)
Get csv file with sequences according to given criteria:
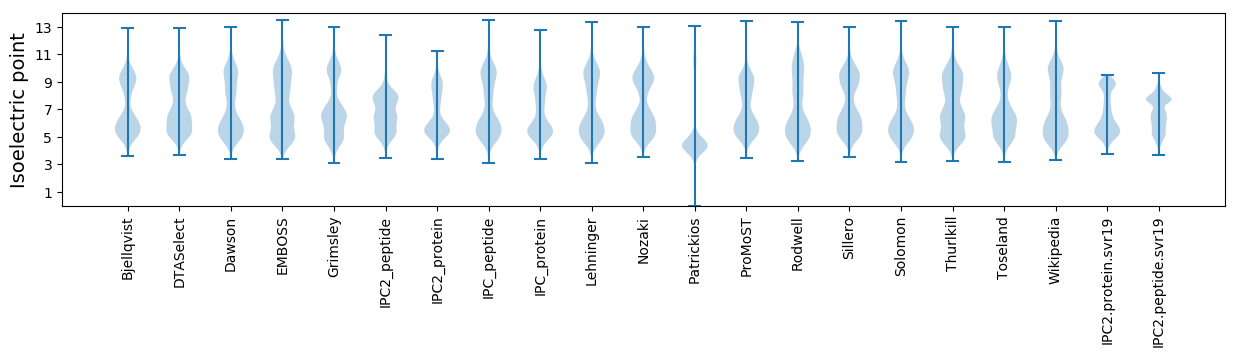
* You can choose from 21 different methods for calculating isoelectric point
Summary statistics related to proteome-wise predictions
Protein with the lowest isoelectric point:
>tr|A0A212PIF8|A0A212PIF8_9DELT Quinol:cytochrome c oxidoreductase pentaheme cytochrome subunit OS=Geobacter sp. DSM 9736 OX=1277350 GN=SAMN06269301_2157 PE=4 SV=1
MM1 pKa = 7.78GILVCYY7 pKa = 10.54DD8 pKa = 3.41DD9 pKa = 3.57FTYY12 pKa = 11.0DD13 pKa = 3.18VVADD17 pKa = 4.23FTFDD21 pKa = 3.51TEE23 pKa = 4.37DD24 pKa = 3.54GRR26 pKa = 11.84IAGYY30 pKa = 10.69DD31 pKa = 3.56NSCDD35 pKa = 3.26WEE37 pKa = 4.35KK38 pKa = 11.36VVMEE42 pKa = 4.57EE43 pKa = 5.29FIPLPPLNVQTVLKK57 pKa = 10.38KK58 pKa = 10.73
MM1 pKa = 7.78GILVCYY7 pKa = 10.54DD8 pKa = 3.41DD9 pKa = 3.57FTYY12 pKa = 11.0DD13 pKa = 3.18VVADD17 pKa = 4.23FTFDD21 pKa = 3.51TEE23 pKa = 4.37DD24 pKa = 3.54GRR26 pKa = 11.84IAGYY30 pKa = 10.69DD31 pKa = 3.56NSCDD35 pKa = 3.26WEE37 pKa = 4.35KK38 pKa = 11.36VVMEE42 pKa = 4.57EE43 pKa = 5.29FIPLPPLNVQTVLKK57 pKa = 10.38KK58 pKa = 10.73
Molecular weight: 6.67 kDa
Isoelectric point according different methods:
Protein with the highest isoelectric point:
>tr|A0A212PK61|A0A212PK61_9DELT Beta sliding clamp OS=Geobacter sp. DSM 9736 OX=1277350 GN=SAMN06269301_2761 PE=3 SV=1
MM1 pKa = 7.45KK2 pKa = 9.61RR3 pKa = 11.84TFQPSNVSRR12 pKa = 11.84KK13 pKa = 7.52RR14 pKa = 11.84THH16 pKa = 6.03GFLVRR21 pKa = 11.84MSTKK25 pKa = 10.31NGRR28 pKa = 11.84LVIKK32 pKa = 10.39RR33 pKa = 11.84RR34 pKa = 11.84RR35 pKa = 11.84AKK37 pKa = 9.74GRR39 pKa = 11.84KK40 pKa = 8.58RR41 pKa = 11.84LAVTIASKK49 pKa = 11.0
MM1 pKa = 7.45KK2 pKa = 9.61RR3 pKa = 11.84TFQPSNVSRR12 pKa = 11.84KK13 pKa = 7.52RR14 pKa = 11.84THH16 pKa = 6.03GFLVRR21 pKa = 11.84MSTKK25 pKa = 10.31NGRR28 pKa = 11.84LVIKK32 pKa = 10.39RR33 pKa = 11.84RR34 pKa = 11.84RR35 pKa = 11.84AKK37 pKa = 9.74GRR39 pKa = 11.84KK40 pKa = 8.58RR41 pKa = 11.84LAVTIASKK49 pKa = 11.0
Molecular weight: 5.72 kDa
Isoelectric point according different methods:
Peptides (in silico digests for buttom-up proteomics)
Below you can find in silico digests of the whole proteome with Trypsin, Chymotrypsin, Trypsin+LysC, LysN, ArgC proteases suitable for different mass spec machines.| Try ESI |
 |
|---|
| ChTry ESI |
|
|---|
| ArgC ESI |
|
|---|
| LysN ESI |
|
|---|
| TryLysC ESI |
|
|---|
| Try MALDI |
|
|---|
| ChTry MALDI |
|
|---|
| ArgC MALDI |
|
|---|
| LysN MALDI |
|
|---|
| TryLysC MALDI |
|
|---|
| Try LTQ |
|
|---|
| ChTry LTQ |
|
|---|
| ArgC LTQ |
|
|---|
| LysN LTQ |
|
|---|
| TryLysC LTQ |
|
|---|
| Try MSlow |
|
|---|
| ChTry MSlow |
|
|---|
| ArgC MSlow |
|
|---|
| LysN MSlow |
|
|---|
| TryLysC MSlow |
|
|---|
| Try MShigh |
|
|---|
| ChTry MShigh |
|
|---|
| ArgC MShigh |
|
|---|
| LysN MShigh |
|
|---|
| TryLysC MShigh |
|
|---|
General Statistics
Number of major isoforms |
Number of additional isoforms |
Number of all proteins |
Number of amino acids |
Min. Seq. Length |
Max. Seq. Length |
Avg. Seq. Length |
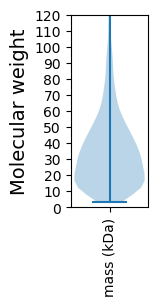
Avg. Mol. Weight |
|---|---|---|---|---|---|---|---|
0 |
1189170 |
29 |
4151 |
338.5 |
37.28 |
Amino acid frequency
Ala |
Cys |
Asp |
Glu |
Phe |
Gly |
His |
Ile |
Lys |
Leu |
|---|---|---|---|---|---|---|---|---|---|
9.339 ± 0.049 | 1.316 ± 0.03 |
5.122 ± 0.029 | 6.689 ± 0.067 |
4.016 ± 0.03 | 8.24 ± 0.052 |
2.095 ± 0.03 | 5.861 ± 0.033 |
4.717 ± 0.044 | 9.946 ± 0.073 |
Met |
Asn |
Gln |
Pro |
Arg |
Ser |
Thr |
Val |
Trp |
Tyr |
|---|---|---|---|---|---|---|---|---|---|
2.432 ± 0.022 | 3.292 ± 0.04 |
4.631 ± 0.03 | 3.036 ± 0.025 |
6.476 ± 0.048 | 6.101 ± 0.048 |
5.444 ± 0.061 | 7.385 ± 0.035 |
1.051 ± 0.019 | 2.811 ± 0.03 |
Most of the basic statistics you can see at this page can be downloaded from this CSV file
See this proteome in:

Proteome-pI is available under Creative Commons Attribution-NoDerivs license, for more details see here
| Reference: Kozlowski LP. Proteome-pI 2.0: Proteome Isoelectric Point Database Update. Nucleic Acids Res. 2021, doi: 10.1093/nar/gkab944 | Contact: Lukasz P. Kozlowski |