Richelia intracellularis HH01
Taxonomy: cellular organisms; Bacteria; Terrabacteria group; Cyanobacteria/Melainabacteria group; Cyanobacteria; Nostocales; Nostocaceae; Richelia; Richelia intracellularis
Average proteome isoelectric point is 6.76
Get precalculated fractions of proteins
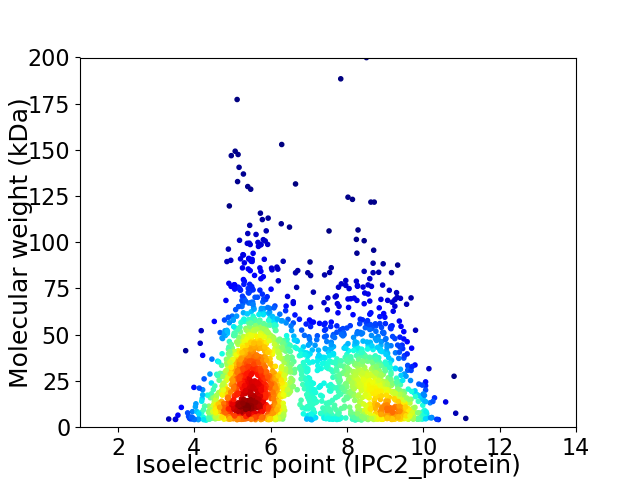
Virtual 2D-PAGE plot for 2278 proteins (isoelectric point calculated using IPC2_protein)
Get csv file with sequences according to given criteria:
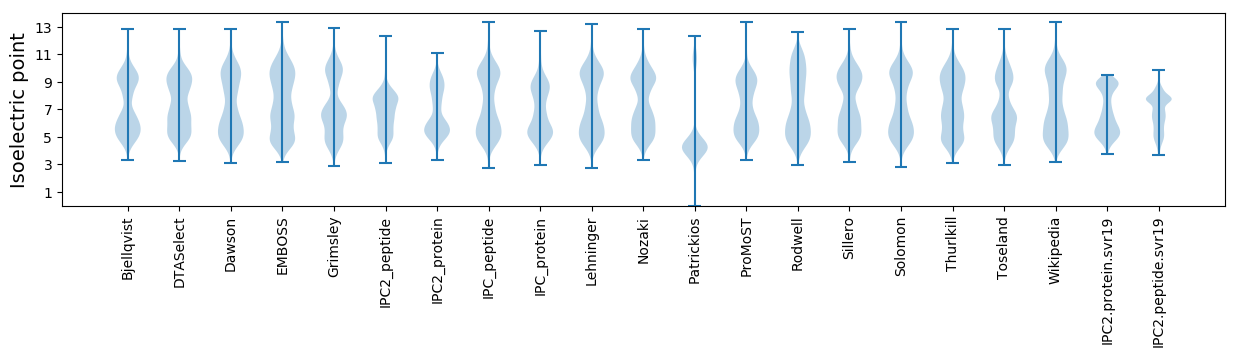
* You can choose from 21 different methods for calculating isoelectric point
Summary statistics related to proteome-wise predictions
Protein with the lowest isoelectric point:
>tr|M1X2Q0|M1X2Q0_9NOST Uncharacterized protein OS=Richelia intracellularis HH01 OX=1165094 GN=RINTHH_10550 PE=4 SV=1
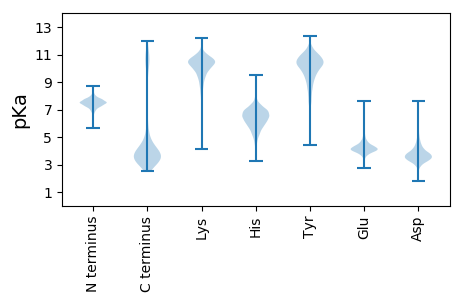
MM1 pKa = 7.02MVLVDD6 pKa = 4.37SYY8 pKa = 11.06DD9 pKa = 3.65TAVLVSGDD17 pKa = 3.51GNLEE21 pKa = 3.97YY22 pKa = 10.82VVNLDD27 pKa = 3.54GYY29 pKa = 9.69RR30 pKa = 11.84DD31 pKa = 3.8VIVVVVSFCSMTNDD45 pKa = 3.16RR46 pKa = 11.84LSNISNSYY54 pKa = 10.26IDD56 pKa = 3.96LEE58 pKa = 4.3EE59 pKa = 4.14VKK61 pKa = 10.78EE62 pKa = 4.55DD63 pKa = 3.51IQKK66 pKa = 9.53TSYY69 pKa = 10.98
MM1 pKa = 7.02MVLVDD6 pKa = 4.37SYY8 pKa = 11.06DD9 pKa = 3.65TAVLVSGDD17 pKa = 3.51GNLEE21 pKa = 3.97YY22 pKa = 10.82VVNLDD27 pKa = 3.54GYY29 pKa = 9.69RR30 pKa = 11.84DD31 pKa = 3.8VIVVVVSFCSMTNDD45 pKa = 3.16RR46 pKa = 11.84LSNISNSYY54 pKa = 10.26IDD56 pKa = 3.96LEE58 pKa = 4.3EE59 pKa = 4.14VKK61 pKa = 10.78EE62 pKa = 4.55DD63 pKa = 3.51IQKK66 pKa = 9.53TSYY69 pKa = 10.98
Molecular weight: 7.75 kDa
Isoelectric point according different methods:
Protein with the highest isoelectric point:
>tr|M1WZ77|M1WZ77_9NOST Expressed protein OS=Richelia intracellularis HH01 OX=1165094 GN=RINTHH_11920 PE=4 SV=1
MM1 pKa = 7.59RR2 pKa = 11.84PVKK5 pKa = 10.4RR6 pKa = 11.84SRR8 pKa = 11.84VNKK11 pKa = 9.63ARR13 pKa = 11.84SAGKK17 pKa = 9.47FRR19 pKa = 11.84KK20 pKa = 9.21QVGKK24 pKa = 8.83TKK26 pKa = 9.71MANLRR31 pKa = 11.84SNPMRR36 pKa = 11.84GGWRR40 pKa = 11.84LL41 pKa = 3.13
MM1 pKa = 7.59RR2 pKa = 11.84PVKK5 pKa = 10.4RR6 pKa = 11.84SRR8 pKa = 11.84VNKK11 pKa = 9.63ARR13 pKa = 11.84SAGKK17 pKa = 9.47FRR19 pKa = 11.84KK20 pKa = 9.21QVGKK24 pKa = 8.83TKK26 pKa = 9.71MANLRR31 pKa = 11.84SNPMRR36 pKa = 11.84GGWRR40 pKa = 11.84LL41 pKa = 3.13
Molecular weight: 4.76 kDa
Isoelectric point according different methods:
Peptides (in silico digests for buttom-up proteomics)
Below you can find in silico digests of the whole proteome with Trypsin, Chymotrypsin, Trypsin+LysC, LysN, ArgC proteases suitable for different mass spec machines.| Try ESI |
 |
|---|
| ChTry ESI |
|
|---|
| ArgC ESI |
|
|---|
| LysN ESI |
|
|---|
| TryLysC ESI |
|
|---|
| Try MALDI |
|
|---|
| ChTry MALDI |
|
|---|
| ArgC MALDI |
|
|---|
| LysN MALDI |
|
|---|
| TryLysC MALDI |
|
|---|
| Try LTQ |
|
|---|
| ChTry LTQ |
|
|---|
| ArgC LTQ |
|
|---|
| LysN LTQ |
|
|---|
| TryLysC LTQ |
|
|---|
| Try MSlow |
|
|---|
| ChTry MSlow |
|
|---|
| ArgC MSlow |
|
|---|
| LysN MSlow |
|
|---|
| TryLysC MSlow |
|
|---|
| Try MShigh |
|
|---|
| ChTry MShigh |
|
|---|
| ArgC MShigh |
|
|---|
| LysN MShigh |
|
|---|
| TryLysC MShigh |
|
|---|
General Statistics
Number of major isoforms |
Number of additional isoforms |
Number of all proteins |
Number of amino acids |
Min. Seq. Length |
Max. Seq. Length |
Avg. Seq. Length |
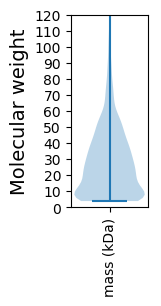
Avg. Mol. Weight |
|---|---|---|---|---|---|---|---|
0 |
598795 |
37 |
1823 |
262.9 |
29.44 |
Amino acid frequency
Ala |
Cys |
Asp |
Glu |
Phe |
Gly |
His |
Ile |
Lys |
Leu |
|---|---|---|---|---|---|---|---|---|---|
6.956 ± 0.043 | 1.177 ± 0.017 |
4.544 ± 0.036 | 5.973 ± 0.045 |
3.909 ± 0.039 | 6.672 ± 0.043 |
2.063 ± 0.024 | 8.137 ± 0.045 |
5.562 ± 0.047 | 10.912 ± 0.059 |
Met |
Asn |
Gln |
Pro |
Arg |
Ser |
Thr |
Val |
Trp |
Tyr |
|---|---|---|---|---|---|---|---|---|---|
2.168 ± 0.021 | 4.87 ± 0.032 |
4.316 ± 0.03 | 4.81 ± 0.046 |
4.783 ± 0.041 | 6.635 ± 0.039 |
5.451 ± 0.029 | 6.433 ± 0.037 |
1.338 ± 0.023 | 3.29 ± 0.032 |
Most of the basic statistics you can see at this page can be downloaded from this CSV file
See this proteome in:

Proteome-pI is available under Creative Commons Attribution-NoDerivs license, for more details see here
| Reference: Kozlowski LP. Proteome-pI 2.0: Proteome Isoelectric Point Database Update. Nucleic Acids Res. 2021, doi: 10.1093/nar/gkab944 | Contact: Lukasz P. Kozlowski |