Terriglobus roseus (strain DSM 18391 / NRRL B-41598 / KBS 63)
Taxonomy: cellular organisms; Bacteria; Acidobacteria; Acidobacteriia; Acidobacteriales; Acidobacteriaceae; Terriglobus; Terriglobus roseus
Average proteome isoelectric point is 6.77
Get precalculated fractions of proteins
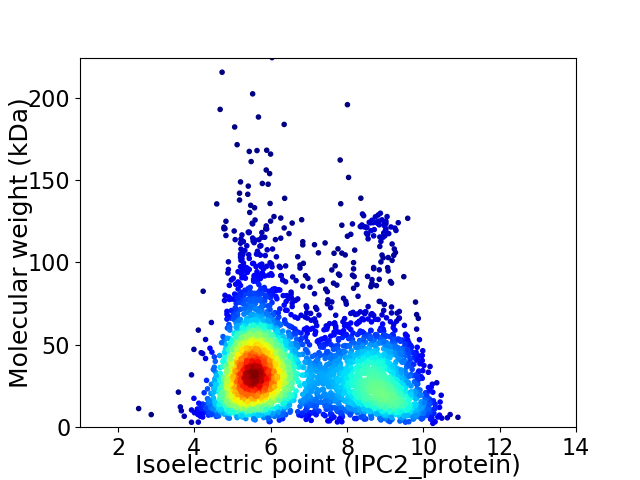
Virtual 2D-PAGE plot for 3936 proteins (isoelectric point calculated using IPC2_protein)
Get csv file with sequences according to given criteria:
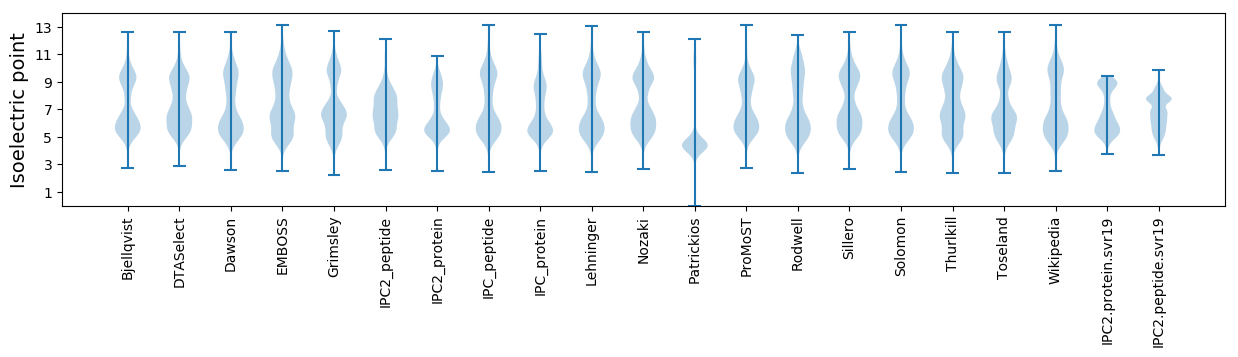
* You can choose from 21 different methods for calculating isoelectric point
Summary statistics related to proteome-wise predictions
Protein with the lowest isoelectric point:
>tr|I3ZC98|I3ZC98_TERRK Uncharacterized protein OS=Terriglobus roseus (strain DSM 18391 / NRRL B-41598 / KBS 63) OX=926566 GN=Terro_0525 PE=4 SV=1
MM1 pKa = 6.94TQQEE5 pKa = 4.2QQLLNGLIDD14 pKa = 3.84RR15 pKa = 11.84VNGTQLGSKK24 pKa = 10.39DD25 pKa = 3.61EE26 pKa = 4.1EE27 pKa = 5.12AEE29 pKa = 4.06ALLKK33 pKa = 9.91RR34 pKa = 11.84TLGSNPDD41 pKa = 3.41ALYY44 pKa = 10.28ILCQTVLVQGFAMDD58 pKa = 5.19KK59 pKa = 10.34SQQDD63 pKa = 3.41LAAARR68 pKa = 11.84SEE70 pKa = 3.76IDD72 pKa = 4.17ALRR75 pKa = 11.84QSQPEE80 pKa = 3.91KK81 pKa = 10.51HH82 pKa = 6.36GSFLGNLFGLGKK94 pKa = 10.0DD95 pKa = 3.96DD96 pKa = 5.47QPQQTAPTNAGPGSTNTPGYY116 pKa = 9.23NAPSYY121 pKa = 11.19APVANAPAVQQQGYY135 pKa = 9.38QGQQGYY141 pKa = 7.88PAQPGYY147 pKa = 10.15GQPAYY152 pKa = 9.32GQPGYY157 pKa = 9.53PPQPGYY163 pKa = 11.19GYY165 pKa = 10.58GGQPMGGGMFGGGGGFLQGAMQTAAGVVAGEE196 pKa = 3.93FAFRR200 pKa = 11.84AIQDD204 pKa = 3.79VFSGGHH210 pKa = 5.47GGEE213 pKa = 4.34HH214 pKa = 6.62GFGGGTEE221 pKa = 4.32VVNNYY226 pKa = 9.81YY227 pKa = 11.02DD228 pKa = 3.59NTSDD232 pKa = 3.55SGSGGFGDD240 pKa = 5.49RR241 pKa = 11.84LAEE244 pKa = 4.2ANNYY248 pKa = 9.32DD249 pKa = 3.65GSVSSDD255 pKa = 2.79IEE257 pKa = 3.93DD258 pKa = 3.46RR259 pKa = 11.84RR260 pKa = 11.84GEE262 pKa = 3.92GHH264 pKa = 6.77GFFGSGDD271 pKa = 3.46DD272 pKa = 4.05SANNGSNFADD282 pKa = 3.84DD283 pKa = 4.52SGNFDD288 pKa = 4.42AGSDD292 pKa = 3.69DD293 pKa = 4.15GGGFDD298 pKa = 5.38GGDD301 pKa = 3.38SGGGDD306 pKa = 3.84DD307 pKa = 5.48NNYY310 pKa = 10.55
MM1 pKa = 6.94TQQEE5 pKa = 4.2QQLLNGLIDD14 pKa = 3.84RR15 pKa = 11.84VNGTQLGSKK24 pKa = 10.39DD25 pKa = 3.61EE26 pKa = 4.1EE27 pKa = 5.12AEE29 pKa = 4.06ALLKK33 pKa = 9.91RR34 pKa = 11.84TLGSNPDD41 pKa = 3.41ALYY44 pKa = 10.28ILCQTVLVQGFAMDD58 pKa = 5.19KK59 pKa = 10.34SQQDD63 pKa = 3.41LAAARR68 pKa = 11.84SEE70 pKa = 3.76IDD72 pKa = 4.17ALRR75 pKa = 11.84QSQPEE80 pKa = 3.91KK81 pKa = 10.51HH82 pKa = 6.36GSFLGNLFGLGKK94 pKa = 10.0DD95 pKa = 3.96DD96 pKa = 5.47QPQQTAPTNAGPGSTNTPGYY116 pKa = 9.23NAPSYY121 pKa = 11.19APVANAPAVQQQGYY135 pKa = 9.38QGQQGYY141 pKa = 7.88PAQPGYY147 pKa = 10.15GQPAYY152 pKa = 9.32GQPGYY157 pKa = 9.53PPQPGYY163 pKa = 11.19GYY165 pKa = 10.58GGQPMGGGMFGGGGGFLQGAMQTAAGVVAGEE196 pKa = 3.93FAFRR200 pKa = 11.84AIQDD204 pKa = 3.79VFSGGHH210 pKa = 5.47GGEE213 pKa = 4.34HH214 pKa = 6.62GFGGGTEE221 pKa = 4.32VVNNYY226 pKa = 9.81YY227 pKa = 11.02DD228 pKa = 3.59NTSDD232 pKa = 3.55SGSGGFGDD240 pKa = 5.49RR241 pKa = 11.84LAEE244 pKa = 4.2ANNYY248 pKa = 9.32DD249 pKa = 3.65GSVSSDD255 pKa = 2.79IEE257 pKa = 3.93DD258 pKa = 3.46RR259 pKa = 11.84RR260 pKa = 11.84GEE262 pKa = 3.92GHH264 pKa = 6.77GFFGSGDD271 pKa = 3.46DD272 pKa = 4.05SANNGSNFADD282 pKa = 3.84DD283 pKa = 4.52SGNFDD288 pKa = 4.42AGSDD292 pKa = 3.69DD293 pKa = 4.15GGGFDD298 pKa = 5.38GGDD301 pKa = 3.38SGGGDD306 pKa = 3.84DD307 pKa = 5.48NNYY310 pKa = 10.55
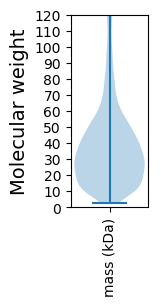
Molecular weight: 31.76 kDa
Isoelectric point according different methods:
Protein with the highest isoelectric point:
>tr|I3ZMX7|I3ZMX7_TERRK 50S ribosomal protein L34 OS=Terriglobus roseus (strain DSM 18391 / NRRL B-41598 / KBS 63) OX=926566 GN=rpmH PE=3 SV=1
MM1 pKa = 8.0PKK3 pKa = 9.02RR4 pKa = 11.84TFQPNRR10 pKa = 11.84RR11 pKa = 11.84RR12 pKa = 11.84RR13 pKa = 11.84AKK15 pKa = 8.87THH17 pKa = 5.78GFLTRR22 pKa = 11.84MKK24 pKa = 9.5TKK26 pKa = 10.57AGQNVLNRR34 pKa = 11.84RR35 pKa = 11.84RR36 pKa = 11.84AKK38 pKa = 10.03GRR40 pKa = 11.84HH41 pKa = 5.72KK42 pKa = 10.29IAVSAGFRR50 pKa = 11.84DD51 pKa = 3.66
MM1 pKa = 8.0PKK3 pKa = 9.02RR4 pKa = 11.84TFQPNRR10 pKa = 11.84RR11 pKa = 11.84RR12 pKa = 11.84RR13 pKa = 11.84AKK15 pKa = 8.87THH17 pKa = 5.78GFLTRR22 pKa = 11.84MKK24 pKa = 9.5TKK26 pKa = 10.57AGQNVLNRR34 pKa = 11.84RR35 pKa = 11.84RR36 pKa = 11.84AKK38 pKa = 10.03GRR40 pKa = 11.84HH41 pKa = 5.72KK42 pKa = 10.29IAVSAGFRR50 pKa = 11.84DD51 pKa = 3.66
Molecular weight: 6.0 kDa
Isoelectric point according different methods:
Peptides (in silico digests for buttom-up proteomics)
Below you can find in silico digests of the whole proteome with Trypsin, Chymotrypsin, Trypsin+LysC, LysN, ArgC proteases suitable for different mass spec machines.| Try ESI |
 |
|---|
| ChTry ESI |
|
|---|
| ArgC ESI |
|
|---|
| LysN ESI |
|
|---|
| TryLysC ESI |
|
|---|
| Try MALDI |
|
|---|
| ChTry MALDI |
|
|---|
| ArgC MALDI |
|
|---|
| LysN MALDI |
|
|---|
| TryLysC MALDI |
|
|---|
| Try LTQ |
|
|---|
| ChTry LTQ |
|
|---|
| ArgC LTQ |
|
|---|
| LysN LTQ |
|
|---|
| TryLysC LTQ |
|
|---|
| Try MSlow |
|
|---|
| ChTry MSlow |
|
|---|
| ArgC MSlow |
|
|---|
| LysN MSlow |
|
|---|
| TryLysC MSlow |
|
|---|
| Try MShigh |
|
|---|
| ChTry MShigh |
|
|---|
| ArgC MShigh |
|
|---|
| LysN MShigh |
|
|---|
| TryLysC MShigh |
|
|---|
General Statistics
Number of major isoforms |
Number of additional isoforms |
Number of all proteins |
Number of amino acids |
Min. Seq. Length |
Max. Seq. Length |
Avg. Seq. Length |
Avg. Mol. Weight |
|---|---|---|---|---|---|---|---|
0 |
1413377 |
21 |
2214 |
359.1 |
39.04 |
Amino acid frequency
Ala |
Cys |
Asp |
Glu |
Phe |
Gly |
His |
Ile |
Lys |
Leu |
|---|---|---|---|---|---|---|---|---|---|
11.391 ± 0.051 | 0.844 ± 0.013 |
5.159 ± 0.033 | 5.102 ± 0.048 |
3.789 ± 0.027 | 8.144 ± 0.042 |
2.22 ± 0.019 | 4.764 ± 0.029 |
3.609 ± 0.035 | 9.873 ± 0.05 |
Met |
Asn |
Gln |
Pro |
Arg |
Ser |
Thr |
Val |
Trp |
Tyr |
|---|---|---|---|---|---|---|---|---|---|
2.386 ± 0.02 | 3.348 ± 0.037 |
5.337 ± 0.028 | 3.798 ± 0.031 |
6.213 ± 0.034 | 6.273 ± 0.034 |
6.471 ± 0.049 | 7.328 ± 0.032 |
1.291 ± 0.015 | 2.661 ± 0.022 |
Most of the basic statistics you can see at this page can be downloaded from this CSV file
See this proteome in:

Proteome-pI is available under Creative Commons Attribution-NoDerivs license, for more details see here
| Reference: Kozlowski LP. Proteome-pI 2.0: Proteome Isoelectric Point Database Update. Nucleic Acids Res. 2021, doi: 10.1093/nar/gkab944 | Contact: Lukasz P. Kozlowski |