Mesorhizobium metallidurans STM 2683
Taxonomy: cellular organisms; Bacteria; Proteobacteria; Alphaproteobacteria; Hyphomicrobiales; Phyllobacteriaceae; Mesorhizobium; Mesorhizobium metallidurans
Average proteome isoelectric point is 6.85
Get precalculated fractions of proteins
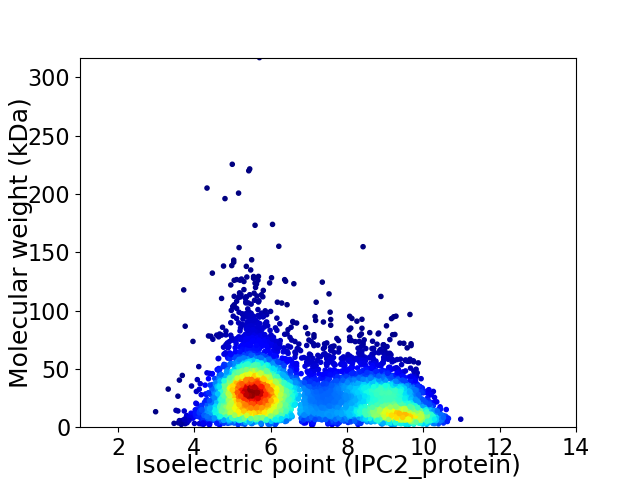
Virtual 2D-PAGE plot for 6696 proteins (isoelectric point calculated using IPC2_protein)
Get csv file with sequences according to given criteria:
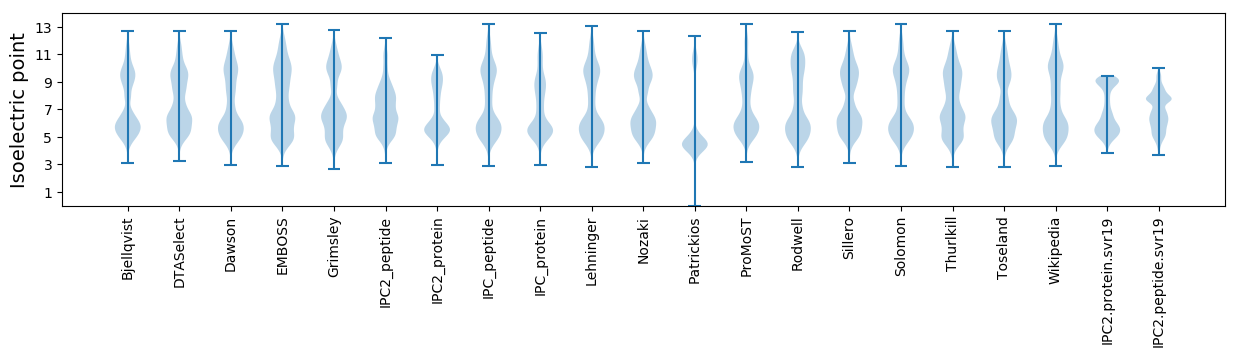
* You can choose from 21 different methods for calculating isoelectric point
Summary statistics related to proteome-wise predictions
Protein with the lowest isoelectric point:
>tr|M5F3Q4|M5F3Q4_9RHIZ Cytochrome P-450 hydroxylase OS=Mesorhizobium metallidurans STM 2683 OX=1297569 GN=MESS2_320017 PE=3 SV=1
MM1 pKa = 7.38AASSVALVWYY11 pKa = 9.21LVIAGPQGGMVVLPSTFDD29 pKa = 3.21TRR31 pKa = 11.84EE32 pKa = 3.59QCTNAVTEE40 pKa = 4.33YY41 pKa = 10.45QKK43 pKa = 10.87QPTPTGWSVQCVPSASPFTDD63 pKa = 2.93EE64 pKa = 5.19GDD66 pKa = 3.7AEE68 pKa = 4.36EE69 pKa = 5.35PSAQQ73 pKa = 3.51
MM1 pKa = 7.38AASSVALVWYY11 pKa = 9.21LVIAGPQGGMVVLPSTFDD29 pKa = 3.21TRR31 pKa = 11.84EE32 pKa = 3.59QCTNAVTEE40 pKa = 4.33YY41 pKa = 10.45QKK43 pKa = 10.87QPTPTGWSVQCVPSASPFTDD63 pKa = 2.93EE64 pKa = 5.19GDD66 pKa = 3.7AEE68 pKa = 4.36EE69 pKa = 5.35PSAQQ73 pKa = 3.51
Molecular weight: 7.73 kDa
Isoelectric point according different methods:
Protein with the highest isoelectric point:
>tr|M5F3H8|M5F3H8_9RHIZ Polar amino acid ABC transporter inner membrane subunit OS=Mesorhizobium metallidurans STM 2683 OX=1297569 GN=MESS2_310021 PE=3 SV=1
MM1 pKa = 7.82RR2 pKa = 11.84PLLGLSHH9 pKa = 7.55LSHH12 pKa = 6.37QKK14 pKa = 9.63WFTPTTGSTSSHH26 pKa = 5.73TGIIAARR33 pKa = 11.84PKK35 pKa = 10.58KK36 pKa = 9.32LTLAIRR42 pKa = 11.84RR43 pKa = 11.84FLLMGLHH50 pKa = 6.5AKK52 pKa = 9.96LRR54 pKa = 11.84AKK56 pKa = 10.46RR57 pKa = 11.84SQKK60 pKa = 10.09PP61 pKa = 3.07
MM1 pKa = 7.82RR2 pKa = 11.84PLLGLSHH9 pKa = 7.55LSHH12 pKa = 6.37QKK14 pKa = 9.63WFTPTTGSTSSHH26 pKa = 5.73TGIIAARR33 pKa = 11.84PKK35 pKa = 10.58KK36 pKa = 9.32LTLAIRR42 pKa = 11.84RR43 pKa = 11.84FLLMGLHH50 pKa = 6.5AKK52 pKa = 9.96LRR54 pKa = 11.84AKK56 pKa = 10.46RR57 pKa = 11.84SQKK60 pKa = 10.09PP61 pKa = 3.07
Molecular weight: 6.84 kDa
Isoelectric point according different methods:
Peptides (in silico digests for buttom-up proteomics)
Below you can find in silico digests of the whole proteome with Trypsin, Chymotrypsin, Trypsin+LysC, LysN, ArgC proteases suitable for different mass spec machines.| Try ESI |
 |
|---|
| ChTry ESI |
|
|---|
| ArgC ESI |
|
|---|
| LysN ESI |
|
|---|
| TryLysC ESI |
|
|---|
| Try MALDI |
|
|---|
| ChTry MALDI |
|
|---|
| ArgC MALDI |
|
|---|
| LysN MALDI |
|
|---|
| TryLysC MALDI |
|
|---|
| Try LTQ |
|
|---|
| ChTry LTQ |
|
|---|
| ArgC LTQ |
|
|---|
| LysN LTQ |
|
|---|
| TryLysC LTQ |
|
|---|
| Try MSlow |
|
|---|
| ChTry MSlow |
|
|---|
| ArgC MSlow |
|
|---|
| LysN MSlow |
|
|---|
| TryLysC MSlow |
|
|---|
| Try MShigh |
|
|---|
| ChTry MShigh |
|
|---|
| ArgC MShigh |
|
|---|
| LysN MShigh |
|
|---|
| TryLysC MShigh |
|
|---|
General Statistics
Number of major isoforms |
Number of additional isoforms |
Number of all proteins |
Number of amino acids |
Min. Seq. Length |
Max. Seq. Length |
Avg. Seq. Length |
Avg. Mol. Weight |
|---|---|---|---|---|---|---|---|
0 |
1837213 |
20 |
2862 |
274.4 |
29.81 |
Amino acid frequency
Ala |
Cys |
Asp |
Glu |
Phe |
Gly |
His |
Ile |
Lys |
Leu |
|---|---|---|---|---|---|---|---|---|---|
12.308 ± 0.038 | 0.887 ± 0.011 |
5.681 ± 0.025 | 5.521 ± 0.031 |
3.851 ± 0.02 | 8.56 ± 0.035 |
2.045 ± 0.015 | 5.436 ± 0.021 |
3.718 ± 0.029 | 9.864 ± 0.036 |
Met |
Asn |
Gln |
Pro |
Arg |
Ser |
Thr |
Val |
Trp |
Tyr |
|---|---|---|---|---|---|---|---|---|---|
2.529 ± 0.013 | 2.694 ± 0.016 |
5.068 ± 0.023 | 3.014 ± 0.019 |
7.093 ± 0.031 | 5.641 ± 0.022 |
5.174 ± 0.021 | 7.366 ± 0.025 |
1.339 ± 0.013 | 2.21 ± 0.015 |
Most of the basic statistics you can see at this page can be downloaded from this CSV file
See this proteome in:

Proteome-pI is available under Creative Commons Attribution-NoDerivs license, for more details see here
| Reference: Kozlowski LP. Proteome-pI 2.0: Proteome Isoelectric Point Database Update. Nucleic Acids Res. 2021, doi: 10.1093/nar/gkab944 | Contact: Lukasz P. Kozlowski |