Tortoise microvirus 100
Taxonomy: Viruses; Monodnaviria; Sangervirae; Phixviricota; Malgrandaviricetes; Petitvirales; Microviridae; unclassified Microviridae
Average proteome isoelectric point is 7.59
Get precalculated fractions of proteins
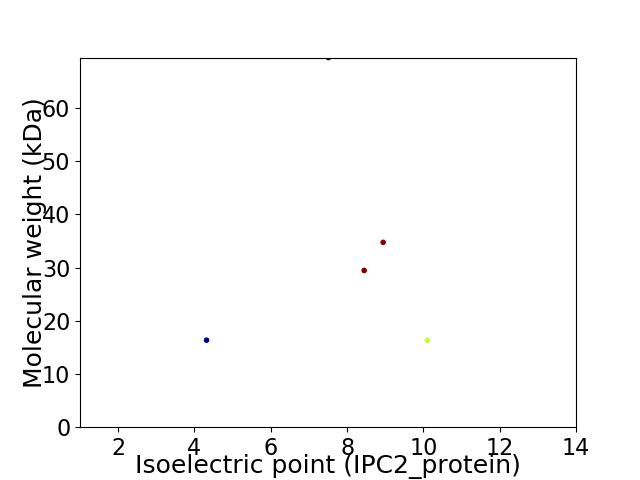
Virtual 2D-PAGE plot for 5 proteins (isoelectric point calculated using IPC2_protein)
Get csv file with sequences according to given criteria:
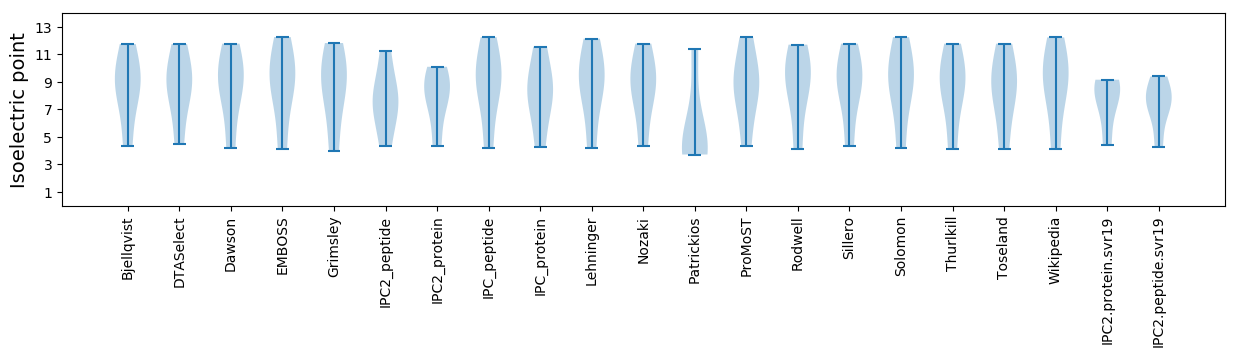
* You can choose from 21 different methods for calculating isoelectric point
Summary statistics related to proteome-wise predictions
Protein with the lowest isoelectric point:
>tr|A0A4P8WAE0|A0A4P8WAE0_9VIRU Uncharacterized protein OS=Tortoise microvirus 100 OX=2583100 PE=4 SV=1
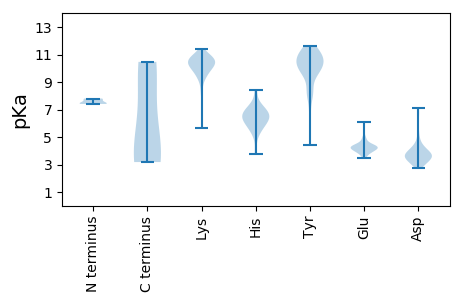
MM1 pKa = 7.8ANNKK5 pKa = 9.53EE6 pKa = 4.24YY7 pKa = 10.2SLKK10 pKa = 10.61MIDD13 pKa = 3.66EE14 pKa = 4.21SRR16 pKa = 11.84KK17 pKa = 9.6ISAEE21 pKa = 3.87KK22 pKa = 10.44LDD24 pKa = 3.85YY25 pKa = 10.64TPIEE29 pKa = 4.22IPVSHH34 pKa = 6.5NVPEE38 pKa = 4.47TFNNTIQKK46 pKa = 9.53ILYY49 pKa = 7.98SSGMISQEE57 pKa = 4.36AYY59 pKa = 10.77HH60 pKa = 6.77KK61 pKa = 10.16MLGINYY67 pKa = 9.58DD68 pKa = 3.7GEE70 pKa = 5.0GDD72 pKa = 4.33GDD74 pKa = 4.66FDD76 pKa = 7.08DD77 pKa = 6.73DD78 pKa = 5.27DD79 pKa = 6.63DD80 pKa = 5.12EE81 pKa = 6.12FDD83 pKa = 3.59EE84 pKa = 5.52VYY86 pKa = 10.17EE87 pKa = 4.13QSPHH91 pKa = 5.93ASYY94 pKa = 11.6DD95 pKa = 3.4EE96 pKa = 4.21GRR98 pKa = 11.84KK99 pKa = 9.12SAEE102 pKa = 4.06VVEE105 pKa = 4.34NTPVEE110 pKa = 4.35TPKK113 pKa = 11.07GGEE116 pKa = 4.06TGNASPGSVDD126 pKa = 3.62PEE128 pKa = 4.16PVVDD132 pKa = 3.92TQPPKK137 pKa = 10.24NAEE140 pKa = 4.28KK141 pKa = 10.5KK142 pKa = 9.96SSSNKK147 pKa = 6.9TT148 pKa = 3.18
MM1 pKa = 7.8ANNKK5 pKa = 9.53EE6 pKa = 4.24YY7 pKa = 10.2SLKK10 pKa = 10.61MIDD13 pKa = 3.66EE14 pKa = 4.21SRR16 pKa = 11.84KK17 pKa = 9.6ISAEE21 pKa = 3.87KK22 pKa = 10.44LDD24 pKa = 3.85YY25 pKa = 10.64TPIEE29 pKa = 4.22IPVSHH34 pKa = 6.5NVPEE38 pKa = 4.47TFNNTIQKK46 pKa = 9.53ILYY49 pKa = 7.98SSGMISQEE57 pKa = 4.36AYY59 pKa = 10.77HH60 pKa = 6.77KK61 pKa = 10.16MLGINYY67 pKa = 9.58DD68 pKa = 3.7GEE70 pKa = 5.0GDD72 pKa = 4.33GDD74 pKa = 4.66FDD76 pKa = 7.08DD77 pKa = 6.73DD78 pKa = 5.27DD79 pKa = 6.63DD80 pKa = 5.12EE81 pKa = 6.12FDD83 pKa = 3.59EE84 pKa = 5.52VYY86 pKa = 10.17EE87 pKa = 4.13QSPHH91 pKa = 5.93ASYY94 pKa = 11.6DD95 pKa = 3.4EE96 pKa = 4.21GRR98 pKa = 11.84KK99 pKa = 9.12SAEE102 pKa = 4.06VVEE105 pKa = 4.34NTPVEE110 pKa = 4.35TPKK113 pKa = 11.07GGEE116 pKa = 4.06TGNASPGSVDD126 pKa = 3.62PEE128 pKa = 4.16PVVDD132 pKa = 3.92TQPPKK137 pKa = 10.24NAEE140 pKa = 4.28KK141 pKa = 10.5KK142 pKa = 9.96SSSNKK147 pKa = 6.9TT148 pKa = 3.18
Molecular weight: 16.35 kDa
Isoelectric point according different methods:
Protein with the highest isoelectric point:
>tr|A0A4P8WAE0|A0A4P8WAE0_9VIRU Uncharacterized protein OS=Tortoise microvirus 100 OX=2583100 PE=4 SV=1
MM1 pKa = 7.44WGLARR6 pKa = 11.84FRR8 pKa = 11.84RR9 pKa = 11.84RR10 pKa = 11.84RR11 pKa = 11.84RR12 pKa = 11.84NRR14 pKa = 11.84RR15 pKa = 11.84RR16 pKa = 11.84PEE18 pKa = 3.44KK19 pKa = 10.06TRR21 pKa = 11.84NEE23 pKa = 4.03VSNKK27 pKa = 9.31KK28 pKa = 10.02RR29 pKa = 11.84LSPLLLKK36 pKa = 10.66PKK38 pKa = 10.09LLNRR42 pKa = 11.84NIEE45 pKa = 4.36TFDD48 pKa = 3.69KK49 pKa = 11.08PQDD52 pKa = 3.6TTRR55 pKa = 11.84KK56 pKa = 9.42LGPRR60 pKa = 11.84LKK62 pKa = 10.03IWSTQNDD69 pKa = 2.84NRR71 pKa = 11.84QNFNNDD77 pKa = 2.74TFSSIRR83 pKa = 11.84NILQLSRR90 pKa = 11.84LIDD93 pKa = 3.57HH94 pKa = 7.07DD95 pKa = 4.66RR96 pKa = 11.84EE97 pKa = 4.01VCRR100 pKa = 11.84RR101 pKa = 11.84RR102 pKa = 11.84KK103 pKa = 7.28TRR105 pKa = 11.84KK106 pKa = 9.85KK107 pKa = 9.87IILKK111 pKa = 6.26MTHH114 pKa = 5.62GRR116 pKa = 11.84GLSVKK121 pKa = 9.25KK122 pKa = 10.81AKK124 pKa = 8.09WTADD128 pKa = 3.15SLINCKK134 pKa = 8.42EE135 pKa = 3.73
MM1 pKa = 7.44WGLARR6 pKa = 11.84FRR8 pKa = 11.84RR9 pKa = 11.84RR10 pKa = 11.84RR11 pKa = 11.84RR12 pKa = 11.84NRR14 pKa = 11.84RR15 pKa = 11.84RR16 pKa = 11.84PEE18 pKa = 3.44KK19 pKa = 10.06TRR21 pKa = 11.84NEE23 pKa = 4.03VSNKK27 pKa = 9.31KK28 pKa = 10.02RR29 pKa = 11.84LSPLLLKK36 pKa = 10.66PKK38 pKa = 10.09LLNRR42 pKa = 11.84NIEE45 pKa = 4.36TFDD48 pKa = 3.69KK49 pKa = 11.08PQDD52 pKa = 3.6TTRR55 pKa = 11.84KK56 pKa = 9.42LGPRR60 pKa = 11.84LKK62 pKa = 10.03IWSTQNDD69 pKa = 2.84NRR71 pKa = 11.84QNFNNDD77 pKa = 2.74TFSSIRR83 pKa = 11.84NILQLSRR90 pKa = 11.84LIDD93 pKa = 3.57HH94 pKa = 7.07DD95 pKa = 4.66RR96 pKa = 11.84EE97 pKa = 4.01VCRR100 pKa = 11.84RR101 pKa = 11.84RR102 pKa = 11.84KK103 pKa = 7.28TRR105 pKa = 11.84KK106 pKa = 9.85KK107 pKa = 9.87IILKK111 pKa = 6.26MTHH114 pKa = 5.62GRR116 pKa = 11.84GLSVKK121 pKa = 9.25KK122 pKa = 10.81AKK124 pKa = 8.09WTADD128 pKa = 3.15SLINCKK134 pKa = 8.42EE135 pKa = 3.73
Molecular weight: 16.32 kDa
Isoelectric point according different methods:
Peptides (in silico digests for buttom-up proteomics)
Below you can find in silico digests of the whole proteome with Trypsin, Chymotrypsin, Trypsin+LysC, LysN, ArgC proteases suitable for different mass spec machines.| Try ESI |
 |
|---|
| ChTry ESI |
|
|---|
| ArgC ESI |
|
|---|
| LysN ESI |
|
|---|
| TryLysC ESI |
|
|---|
| Try MALDI |
|
|---|
| ChTry MALDI |
|
|---|
| ArgC MALDI |
|
|---|
| LysN MALDI |
|
|---|
| TryLysC MALDI |
|
|---|
| Try LTQ |
|
|---|
| ChTry LTQ |
|
|---|
| ArgC LTQ |
|
|---|
| LysN LTQ |
|
|---|
| TryLysC LTQ |
|
|---|
| Try MSlow |
|
|---|
| ChTry MSlow |
|
|---|
| ArgC MSlow |
|
|---|
| LysN MSlow |
|
|---|
| TryLysC MSlow |
|
|---|
| Try MShigh |
|
|---|
| ChTry MShigh |
|
|---|
| ArgC MShigh |
|
|---|
| LysN MShigh |
|
|---|
| TryLysC MShigh |
|
|---|
General Statistics
Number of major isoforms |
Number of additional isoforms |
Number of all proteins |
Number of amino acids |
Min. Seq. Length |
Max. Seq. Length |
Avg. Seq. Length |
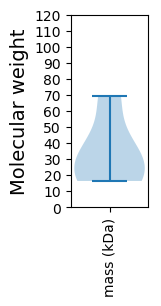
Avg. Mol. Weight |
|---|---|---|---|---|---|---|---|
0 |
1446 |
135 |
607 |
289.2 |
33.25 |
Amino acid frequency
Ala |
Cys |
Asp |
Glu |
Phe |
Gly |
His |
Ile |
Lys |
Leu |
|---|---|---|---|---|---|---|---|---|---|
4.772 ± 1.012 | 0.83 ± 0.469 |
5.463 ± 0.575 | 5.118 ± 0.846 |
5.74 ± 0.804 | 5.602 ± 0.508 |
1.452 ± 0.357 | 5.463 ± 0.302 |
7.054 ± 1.354 | 8.091 ± 0.79 |
Met |
Asn |
Gln |
Pro |
Arg |
Ser |
Thr |
Val |
Trp |
Tyr |
|---|---|---|---|---|---|---|---|---|---|
2.075 ± 0.356 | 7.192 ± 0.703 |
4.703 ± 0.451 | 4.564 ± 0.861 |
5.878 ± 1.592 | 8.299 ± 0.487 |
5.947 ± 1.317 | 5.463 ± 0.685 |
1.383 ± 0.201 | 4.91 ± 0.983 |
Most of the basic statistics you can see at this page can be downloaded from this CSV file
See this proteome in:

Proteome-pI is available under Creative Commons Attribution-NoDerivs license, for more details see here
| Reference: Kozlowski LP. Proteome-pI 2.0: Proteome Isoelectric Point Database Update. Nucleic Acids Res. 2021, doi: 10.1093/nar/gkab944 | Contact: Lukasz P. Kozlowski |