Escherichia phage 1720a-02
Taxonomy: Viruses; Duplodnaviria; Heunggongvirae; Uroviricota; Caudoviricetes; Caudovirales; Siphoviridae; unclassified Siphoviridae
Average proteome isoelectric point is 6.83
Get precalculated fractions of proteins
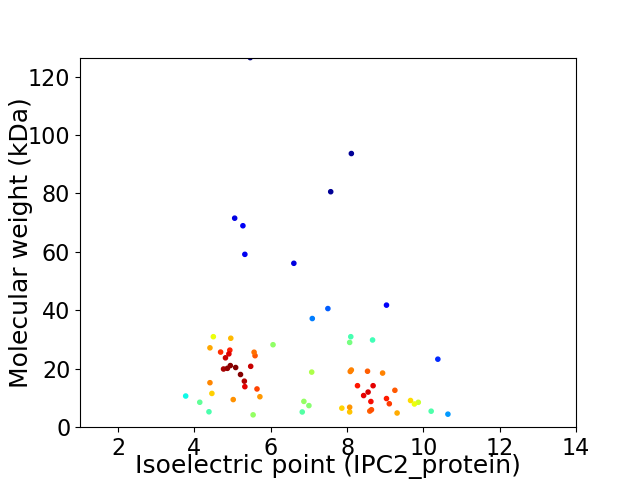
Virtual 2D-PAGE plot for 68 proteins (isoelectric point calculated using IPC2_protein)
Get csv file with sequences according to given criteria:
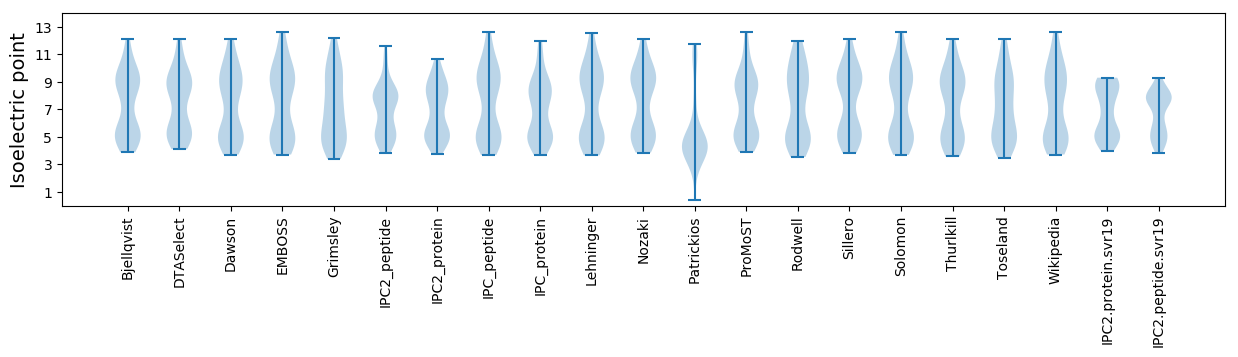
* You can choose from 21 different methods for calculating isoelectric point
Summary statistics related to proteome-wise predictions
Protein with the lowest isoelectric point:
>tr|S5M7Q0|S5M7Q0_9CAUD Uncharacterized protein OS=Escherichia phage 1720a-02 OX=1115653 PE=4 SV=1
MM1 pKa = 7.49TEE3 pKa = 3.97LSFFVHH9 pKa = 6.37PVDD12 pKa = 4.27MDD14 pKa = 3.81DD15 pKa = 5.07FSDD18 pKa = 3.6FRR20 pKa = 11.84KK21 pKa = 10.33SVFCPGAVACFIRR34 pKa = 11.84DD35 pKa = 3.81AIFAGYY41 pKa = 10.07SEE43 pKa = 5.61FSACC47 pKa = 5.25
MM1 pKa = 7.49TEE3 pKa = 3.97LSFFVHH9 pKa = 6.37PVDD12 pKa = 4.27MDD14 pKa = 3.81DD15 pKa = 5.07FSDD18 pKa = 3.6FRR20 pKa = 11.84KK21 pKa = 10.33SVFCPGAVACFIRR34 pKa = 11.84DD35 pKa = 3.81AIFAGYY41 pKa = 10.07SEE43 pKa = 5.61FSACC47 pKa = 5.25
Molecular weight: 5.28 kDa
Isoelectric point according different methods:
Protein with the highest isoelectric point:
>tr|S5MDR7|S5MDR7_9CAUD Regulatory protein OS=Escherichia phage 1720a-02 OX=1115653 PE=4 SV=1
MM1 pKa = 7.28IRR3 pKa = 11.84NIFKK7 pKa = 10.82RR8 pKa = 11.84FTNQTFRR15 pKa = 11.84CPRR18 pKa = 11.84PGQWYY23 pKa = 5.47TTPAGHH29 pKa = 6.23VLRR32 pKa = 11.84VSLVDD37 pKa = 3.87RR38 pKa = 11.84EE39 pKa = 4.3CQKK42 pKa = 10.88VICEE46 pKa = 4.01PLGRR50 pKa = 11.84NYY52 pKa = 9.75RR53 pKa = 11.84VSMPLIAFRR62 pKa = 11.84SGKK65 pKa = 8.95NMKK68 pKa = 9.95HH69 pKa = 6.22LGGAAA74 pKa = 3.13
MM1 pKa = 7.28IRR3 pKa = 11.84NIFKK7 pKa = 10.82RR8 pKa = 11.84FTNQTFRR15 pKa = 11.84CPRR18 pKa = 11.84PGQWYY23 pKa = 5.47TTPAGHH29 pKa = 6.23VLRR32 pKa = 11.84VSLVDD37 pKa = 3.87RR38 pKa = 11.84EE39 pKa = 4.3CQKK42 pKa = 10.88VICEE46 pKa = 4.01PLGRR50 pKa = 11.84NYY52 pKa = 9.75RR53 pKa = 11.84VSMPLIAFRR62 pKa = 11.84SGKK65 pKa = 8.95NMKK68 pKa = 9.95HH69 pKa = 6.22LGGAAA74 pKa = 3.13
Molecular weight: 8.52 kDa
Isoelectric point according different methods:
Peptides (in silico digests for buttom-up proteomics)
Below you can find in silico digests of the whole proteome with Trypsin, Chymotrypsin, Trypsin+LysC, LysN, ArgC proteases suitable for different mass spec machines.| Try ESI |
 |
|---|
| ChTry ESI |
|
|---|
| ArgC ESI |
|
|---|
| LysN ESI |
|
|---|
| TryLysC ESI |
|
|---|
| Try MALDI |
|
|---|
| ChTry MALDI |
|
|---|
| ArgC MALDI |
|
|---|
| LysN MALDI |
|
|---|
| TryLysC MALDI |
|
|---|
| Try LTQ |
|
|---|
| ChTry LTQ |
|
|---|
| ArgC LTQ |
|
|---|
| LysN LTQ |
|
|---|
| TryLysC LTQ |
|
|---|
| Try MSlow |
|
|---|
| ChTry MSlow |
|
|---|
| ArgC MSlow |
|
|---|
| LysN MSlow |
|
|---|
| TryLysC MSlow |
|
|---|
| Try MShigh |
|
|---|
| ChTry MShigh |
|
|---|
| ArgC MShigh |
|
|---|
| LysN MShigh |
|
|---|
| TryLysC MShigh |
|
|---|
General Statistics
Number of major isoforms |
Number of additional isoforms |
Number of all proteins |
Number of amino acids |
Min. Seq. Length |
Max. Seq. Length |
Avg. Seq. Length |
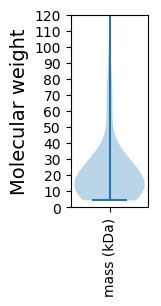
Avg. Mol. Weight |
|---|---|---|---|---|---|---|---|
0 |
14165 |
38 |
1155 |
208.3 |
23.13 |
Amino acid frequency
Ala |
Cys |
Asp |
Glu |
Phe |
Gly |
His |
Ile |
Lys |
Leu |
|---|---|---|---|---|---|---|---|---|---|
9.756 ± 0.521 | 1.384 ± 0.164 |
5.711 ± 0.197 | 6.636 ± 0.232 |
3.572 ± 0.19 | 7.78 ± 0.435 |
1.807 ± 0.167 | 5.111 ± 0.261 |
5.344 ± 0.295 | 7.857 ± 0.258 |
Met |
Asn |
Gln |
Pro |
Arg |
Ser |
Thr |
Val |
Trp |
Tyr |
|---|---|---|---|---|---|---|---|---|---|
2.718 ± 0.206 | 4.038 ± 0.168 |
4.391 ± 0.232 | 3.925 ± 0.281 |
6.608 ± 0.402 | 6.22 ± 0.218 |
5.824 ± 0.37 | 6.565 ± 0.26 |
1.814 ± 0.116 | 2.937 ± 0.144 |
Most of the basic statistics you can see at this page can be downloaded from this CSV file
See this proteome in:

Proteome-pI is available under Creative Commons Attribution-NoDerivs license, for more details see here
| Reference: Kozlowski LP. Proteome-pI 2.0: Proteome Isoelectric Point Database Update. Nucleic Acids Res. 2021, doi: 10.1093/nar/gkab944 | Contact: Lukasz P. Kozlowski |