Pseudomonas phage LKA1
Taxonomy: Viruses; Duplodnaviria; Heunggongvirae; Uroviricota; Caudoviricetes; Caudovirales; Autographiviridae; Krylovirinae; Stubburvirus; Pseudomonas virus LKA1
Average proteome isoelectric point is 6.28
Get precalculated fractions of proteins
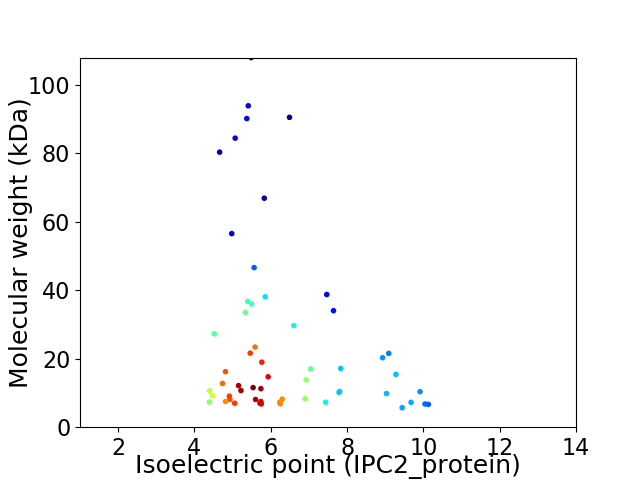
Virtual 2D-PAGE plot for 57 proteins (isoelectric point calculated using IPC2_protein)
Get csv file with sequences according to given criteria:
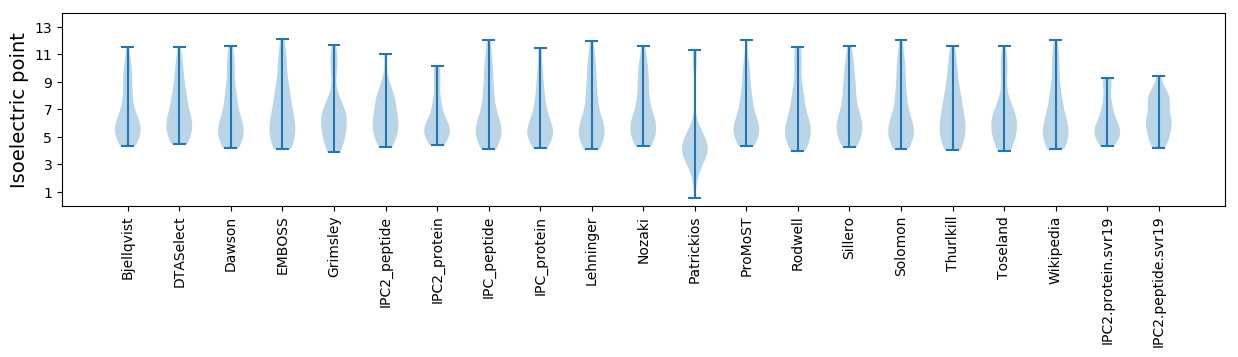
* You can choose from 21 different methods for calculating isoelectric point
Summary statistics related to proteome-wise predictions
Protein with the lowest isoelectric point:
>tr|Q0E607|Q0E607_9CAUD Uncharacterized protein OS=Pseudomonas phage LKA1 OX=386793 PE=4 SV=1
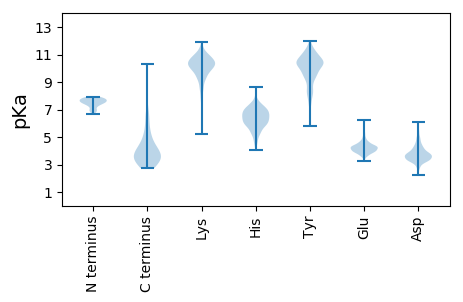
MM1 pKa = 7.68IYY3 pKa = 10.52LYY5 pKa = 10.68LFSLLWSLSAWALISFRR22 pKa = 11.84TDD24 pKa = 3.98EE25 pKa = 4.22KK26 pKa = 11.41LLWNLIDD33 pKa = 3.59SAVFAGVLTTMLAEE47 pKa = 4.14YY48 pKa = 9.62QWWVGLGRR56 pKa = 11.84NILEE60 pKa = 4.52YY61 pKa = 10.73INAA64 pKa = 4.27
MM1 pKa = 7.68IYY3 pKa = 10.52LYY5 pKa = 10.68LFSLLWSLSAWALISFRR22 pKa = 11.84TDD24 pKa = 3.98EE25 pKa = 4.22KK26 pKa = 11.41LLWNLIDD33 pKa = 3.59SAVFAGVLTTMLAEE47 pKa = 4.14YY48 pKa = 9.62QWWVGLGRR56 pKa = 11.84NILEE60 pKa = 4.52YY61 pKa = 10.73INAA64 pKa = 4.27
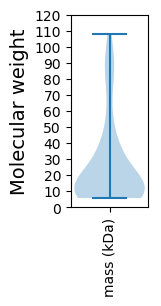
Molecular weight: 7.5 kDa
Isoelectric point according different methods:
Protein with the highest isoelectric point:
>tr|Q0E5Y7|Q0E5Y7_9CAUD DNA ligase OS=Pseudomonas phage LKA1 OX=386793 GN=gp27 PE=4 SV=1
MM1 pKa = 7.76RR2 pKa = 11.84KK3 pKa = 9.66SLMLQLGPTPKK14 pKa = 10.03PGVVLGIGWDD24 pKa = 3.43WSRR27 pKa = 11.84PWKK30 pKa = 8.57ATYY33 pKa = 10.35YY34 pKa = 9.62PLDD37 pKa = 3.64GGRR40 pKa = 11.84LVSGSLGVGKK50 pKa = 10.48VWVFYY55 pKa = 8.94WWRR58 pKa = 11.84KK59 pKa = 6.86
MM1 pKa = 7.76RR2 pKa = 11.84KK3 pKa = 9.66SLMLQLGPTPKK14 pKa = 10.03PGVVLGIGWDD24 pKa = 3.43WSRR27 pKa = 11.84PWKK30 pKa = 8.57ATYY33 pKa = 10.35YY34 pKa = 9.62PLDD37 pKa = 3.64GGRR40 pKa = 11.84LVSGSLGVGKK50 pKa = 10.48VWVFYY55 pKa = 8.94WWRR58 pKa = 11.84KK59 pKa = 6.86
Molecular weight: 6.78 kDa
Isoelectric point according different methods:
Peptides (in silico digests for buttom-up proteomics)
Below you can find in silico digests of the whole proteome with Trypsin, Chymotrypsin, Trypsin+LysC, LysN, ArgC proteases suitable for different mass spec machines.| Try ESI |
 |
|---|
| ChTry ESI |
|
|---|
| ArgC ESI |
|
|---|
| LysN ESI |
|
|---|
| TryLysC ESI |
|
|---|
| Try MALDI |
|
|---|
| ChTry MALDI |
|
|---|
| ArgC MALDI |
|
|---|
| LysN MALDI |
|
|---|
| TryLysC MALDI |
|
|---|
| Try LTQ |
|
|---|
| ChTry LTQ |
|
|---|
| ArgC LTQ |
|
|---|
| LysN LTQ |
|
|---|
| TryLysC LTQ |
|
|---|
| Try MSlow |
|
|---|
| ChTry MSlow |
|
|---|
| ArgC MSlow |
|
|---|
| LysN MSlow |
|
|---|
| TryLysC MSlow |
|
|---|
| Try MShigh |
|
|---|
| ChTry MShigh |
|
|---|
| ArgC MShigh |
|
|---|
| LysN MShigh |
|
|---|
| TryLysC MShigh |
|
|---|
General Statistics
Number of major isoforms |
Number of additional isoforms |
Number of all proteins |
Number of amino acids |
Min. Seq. Length |
Max. Seq. Length |
Avg. Seq. Length |
Avg. Mol. Weight |
|---|---|---|---|---|---|---|---|
0 |
13094 |
50 |
1003 |
229.7 |
25.33 |
Amino acid frequency
Ala |
Cys |
Asp |
Glu |
Phe |
Gly |
His |
Ile |
Lys |
Leu |
|---|---|---|---|---|---|---|---|---|---|
11.547 ± 0.504 | 1.214 ± 0.173 |
5.72 ± 0.211 | 6.522 ± 0.361 |
3.04 ± 0.15 | 7.996 ± 0.288 |
2.123 ± 0.22 | 4.017 ± 0.181 |
4.162 ± 0.274 | 9.333 ± 0.285 |
Met |
Asn |
Gln |
Pro |
Arg |
Ser |
Thr |
Val |
Trp |
Tyr |
|---|---|---|---|---|---|---|---|---|---|
2.215 ± 0.159 | 3.131 ± 0.172 |
4.468 ± 0.251 | 4.758 ± 0.333 |
6.85 ± 0.33 | 5.247 ± 0.324 |
5.667 ± 0.349 | 7.087 ± 0.308 |
1.657 ± 0.131 | 3.246 ± 0.221 |
Most of the basic statistics you can see at this page can be downloaded from this CSV file
See this proteome in:

Proteome-pI is available under Creative Commons Attribution-NoDerivs license, for more details see here
| Reference: Kozlowski LP. Proteome-pI 2.0: Proteome Isoelectric Point Database Update. Nucleic Acids Res. 2021, doi: 10.1093/nar/gkab944 | Contact: Lukasz P. Kozlowski |