Shigella phage DS8
Taxonomy: Viruses; Duplodnaviria; Heunggongvirae; Uroviricota; Caudoviricetes; Caudovirales; Siphoviridae; unclassified Siphoviridae
Average proteome isoelectric point is 6.22
Get precalculated fractions of proteins
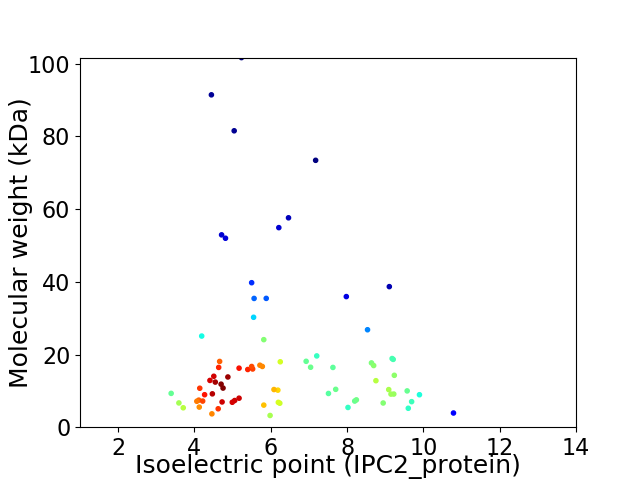
Virtual 2D-PAGE plot for 78 proteins (isoelectric point calculated using IPC2_protein)
Get csv file with sequences according to given criteria:
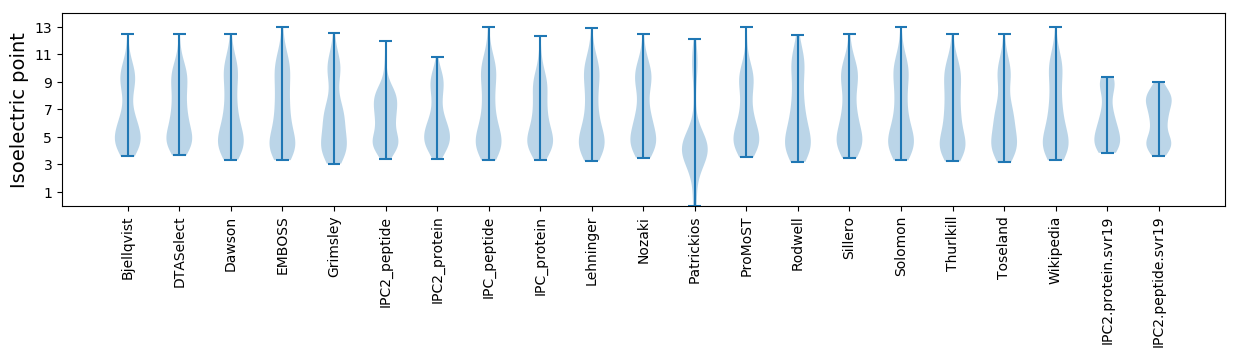
* You can choose from 21 different methods for calculating isoelectric point
Summary statistics related to proteome-wise predictions
Protein with the lowest isoelectric point:
>tr|A0A4P8MU02|A0A4P8MU02_9CAUD Uncharacterized protein OS=Shigella phage DS8 OX=2565502 PE=4 SV=1
MM1 pKa = 6.99SQWIKK6 pKa = 10.71CSEE9 pKa = 3.92QMPDD13 pKa = 2.99EE14 pKa = 4.32NAEE17 pKa = 4.14QEE19 pKa = 4.29VLACFKK25 pKa = 11.09GGDD28 pKa = 3.6ISTLYY33 pKa = 10.2YY34 pKa = 10.61FEE36 pKa = 5.37GRR38 pKa = 11.84WDD40 pKa = 3.49DD41 pKa = 3.55AYY43 pKa = 10.81GVVPIRR49 pKa = 11.84QDD51 pKa = 3.16VTHH54 pKa = 7.07WMPLPDD60 pKa = 4.92PPQEE64 pKa = 3.92
MM1 pKa = 6.99SQWIKK6 pKa = 10.71CSEE9 pKa = 3.92QMPDD13 pKa = 2.99EE14 pKa = 4.32NAEE17 pKa = 4.14QEE19 pKa = 4.29VLACFKK25 pKa = 11.09GGDD28 pKa = 3.6ISTLYY33 pKa = 10.2YY34 pKa = 10.61FEE36 pKa = 5.37GRR38 pKa = 11.84WDD40 pKa = 3.49DD41 pKa = 3.55AYY43 pKa = 10.81GVVPIRR49 pKa = 11.84QDD51 pKa = 3.16VTHH54 pKa = 7.07WMPLPDD60 pKa = 4.92PPQEE64 pKa = 3.92
Molecular weight: 7.45 kDa
Isoelectric point according different methods:
Protein with the highest isoelectric point:
>tr|A0A4P8MUB7|A0A4P8MUB7_9CAUD Uncharacterized protein OS=Shigella phage DS8 OX=2565502 PE=4 SV=1
MM1 pKa = 7.76GSTNSPSRR9 pKa = 11.84SRR11 pKa = 11.84ATGNTKK17 pKa = 9.72TGGKK21 pKa = 7.78TGAVKK26 pKa = 10.54PNGSTRR32 pKa = 11.84SPSRR36 pKa = 11.84GKK38 pKa = 10.36KK39 pKa = 9.35
MM1 pKa = 7.76GSTNSPSRR9 pKa = 11.84SRR11 pKa = 11.84ATGNTKK17 pKa = 9.72TGGKK21 pKa = 7.78TGAVKK26 pKa = 10.54PNGSTRR32 pKa = 11.84SPSRR36 pKa = 11.84GKK38 pKa = 10.36KK39 pKa = 9.35
Molecular weight: 3.91 kDa
Isoelectric point according different methods:
Peptides (in silico digests for buttom-up proteomics)
Below you can find in silico digests of the whole proteome with Trypsin, Chymotrypsin, Trypsin+LysC, LysN, ArgC proteases suitable for different mass spec machines.| Try ESI |
 |
|---|
| ChTry ESI |
|
|---|
| ArgC ESI |
|
|---|
| LysN ESI |
|
|---|
| TryLysC ESI |
|
|---|
| Try MALDI |
|
|---|
| ChTry MALDI |
|
|---|
| ArgC MALDI |
|
|---|
| LysN MALDI |
|
|---|
| TryLysC MALDI |
|
|---|
| Try LTQ |
|
|---|
| ChTry LTQ |
|
|---|
| ArgC LTQ |
|
|---|
| LysN LTQ |
|
|---|
| TryLysC LTQ |
|
|---|
| Try MSlow |
|
|---|
| ChTry MSlow |
|
|---|
| ArgC MSlow |
|
|---|
| LysN MSlow |
|
|---|
| TryLysC MSlow |
|
|---|
| Try MShigh |
|
|---|
| ChTry MShigh |
|
|---|
| ArgC MShigh |
|
|---|
| LysN MShigh |
|
|---|
| TryLysC MShigh |
|
|---|
General Statistics
Number of major isoforms |
Number of additional isoforms |
Number of all proteins |
Number of amino acids |
Min. Seq. Length |
Max. Seq. Length |
Avg. Seq. Length |
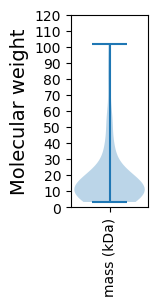
Avg. Mol. Weight |
|---|---|---|---|---|---|---|---|
0 |
13577 |
31 |
969 |
174.1 |
19.52 |
Amino acid frequency
Ala |
Cys |
Asp |
Glu |
Phe |
Gly |
His |
Ile |
Lys |
Leu |
|---|---|---|---|---|---|---|---|---|---|
9.03 ± 0.596 | 1.488 ± 0.18 |
6.283 ± 0.303 | 6.769 ± 0.272 |
3.565 ± 0.177 | 6.754 ± 0.21 |
1.738 ± 0.182 | 6.548 ± 0.197 |
6.54 ± 0.36 | 7.056 ± 0.203 |
Met |
Asn |
Gln |
Pro |
Arg |
Ser |
Thr |
Val |
Trp |
Tyr |
|---|---|---|---|---|---|---|---|---|---|
3.248 ± 0.183 | 4.891 ± 0.208 |
3.366 ± 0.234 | 4.029 ± 0.353 |
5.112 ± 0.285 | 6.401 ± 0.352 |
5.428 ± 0.386 | 6.253 ± 0.277 |
1.628 ± 0.14 | 3.874 ± 0.196 |
Most of the basic statistics you can see at this page can be downloaded from this CSV file
See this proteome in:

Proteome-pI is available under Creative Commons Attribution-NoDerivs license, for more details see here
| Reference: Kozlowski LP. Proteome-pI 2.0: Proteome Isoelectric Point Database Update. Nucleic Acids Res. 2021, doi: 10.1093/nar/gkab944 | Contact: Lukasz P. Kozlowski |