Aquabacterium sp. KMB7
Taxonomy: cellular organisms; Bacteria; Proteobacteria; Betaproteobacteria; Burkholderiales; Burkholderiales genera incertae sedis; Aquabacterium
Average proteome isoelectric point is 6.89
Get precalculated fractions of proteins
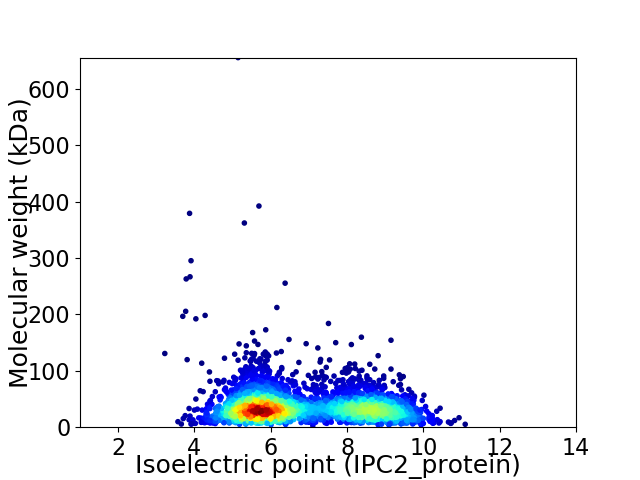
Virtual 2D-PAGE plot for 3324 proteins (isoelectric point calculated using IPC2_protein)
Get csv file with sequences according to given criteria:
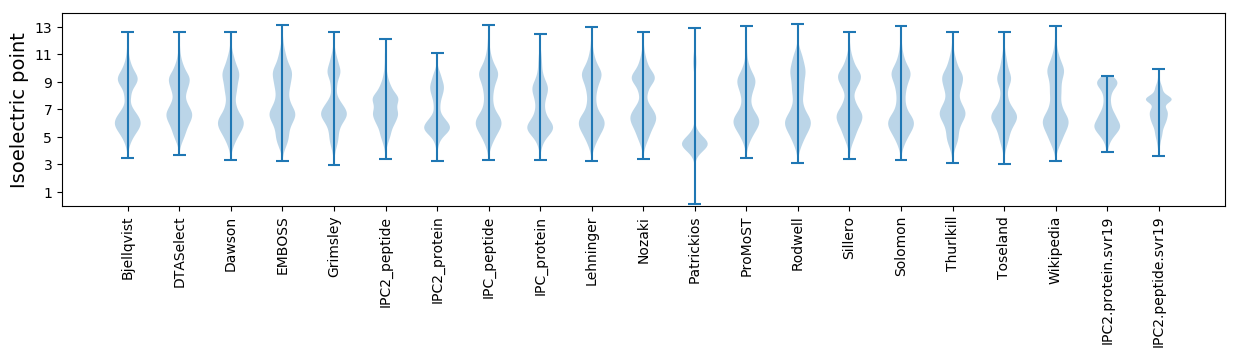
* You can choose from 21 different methods for calculating isoelectric point
Summary statistics related to proteome-wise predictions
Protein with the lowest isoelectric point:
>tr|A0A4V2JFT9|A0A4V2JFT9_9BURK Heme utilization protein OS=Aquabacterium sp. KMB7 OX=2528630 GN=EYS42_04985 PE=4 SV=1
MM1 pKa = 7.35KK2 pKa = 9.59TYY4 pKa = 10.56QCIVCGYY11 pKa = 9.88VYY13 pKa = 10.74DD14 pKa = 4.34EE15 pKa = 4.8AAGSPSEE22 pKa = 4.76GIAPGTKK29 pKa = 8.99WEE31 pKa = 4.64DD32 pKa = 3.73VPDD35 pKa = 3.42SWVCPDD41 pKa = 3.95CGVGKK46 pKa = 10.46SDD48 pKa = 4.16FEE50 pKa = 4.18MVEE53 pKa = 3.82II54 pKa = 5.08
MM1 pKa = 7.35KK2 pKa = 9.59TYY4 pKa = 10.56QCIVCGYY11 pKa = 9.88VYY13 pKa = 10.74DD14 pKa = 4.34EE15 pKa = 4.8AAGSPSEE22 pKa = 4.76GIAPGTKK29 pKa = 8.99WEE31 pKa = 4.64DD32 pKa = 3.73VPDD35 pKa = 3.42SWVCPDD41 pKa = 3.95CGVGKK46 pKa = 10.46SDD48 pKa = 4.16FEE50 pKa = 4.18MVEE53 pKa = 3.82II54 pKa = 5.08
Molecular weight: 5.86 kDa
Isoelectric point according different methods:
Protein with the highest isoelectric point:
>tr|A0A4V2JFK2|A0A4V2JFK2_9BURK Chain length-determining protein OS=Aquabacterium sp. KMB7 OX=2528630 GN=EYS42_11185 PE=4 SV=1
MM1 pKa = 7.35KK2 pKa = 9.43RR3 pKa = 11.84TYY5 pKa = 10.25QPSKK9 pKa = 7.79TRR11 pKa = 11.84RR12 pKa = 11.84ARR14 pKa = 11.84THH16 pKa = 5.79GFLVRR21 pKa = 11.84MKK23 pKa = 9.67TKK25 pKa = 10.48GGRR28 pKa = 11.84KK29 pKa = 9.03VINARR34 pKa = 11.84RR35 pKa = 11.84AKK37 pKa = 9.44GRR39 pKa = 11.84KK40 pKa = 9.07RR41 pKa = 11.84LGLL44 pKa = 3.7
MM1 pKa = 7.35KK2 pKa = 9.43RR3 pKa = 11.84TYY5 pKa = 10.25QPSKK9 pKa = 7.79TRR11 pKa = 11.84RR12 pKa = 11.84ARR14 pKa = 11.84THH16 pKa = 5.79GFLVRR21 pKa = 11.84MKK23 pKa = 9.67TKK25 pKa = 10.48GGRR28 pKa = 11.84KK29 pKa = 9.03VINARR34 pKa = 11.84RR35 pKa = 11.84AKK37 pKa = 9.44GRR39 pKa = 11.84KK40 pKa = 9.07RR41 pKa = 11.84LGLL44 pKa = 3.7
Molecular weight: 5.17 kDa
Isoelectric point according different methods:
Peptides (in silico digests for buttom-up proteomics)
Below you can find in silico digests of the whole proteome with Trypsin, Chymotrypsin, Trypsin+LysC, LysN, ArgC proteases suitable for different mass spec machines.| Try ESI |
 |
|---|
| ChTry ESI |
|
|---|
| ArgC ESI |
|
|---|
| LysN ESI |
|
|---|
| TryLysC ESI |
|
|---|
| Try MALDI |
|
|---|
| ChTry MALDI |
|
|---|
| ArgC MALDI |
|
|---|
| LysN MALDI |
|
|---|
| TryLysC MALDI |
|
|---|
| Try LTQ |
|
|---|
| ChTry LTQ |
|
|---|
| ArgC LTQ |
|
|---|
| LysN LTQ |
|
|---|
| TryLysC LTQ |
|
|---|
| Try MSlow |
|
|---|
| ChTry MSlow |
|
|---|
| ArgC MSlow |
|
|---|
| LysN MSlow |
|
|---|
| TryLysC MSlow |
|
|---|
| Try MShigh |
|
|---|
| ChTry MShigh |
|
|---|
| ArgC MShigh |
|
|---|
| LysN MShigh |
|
|---|
| TryLysC MShigh |
|
|---|
General Statistics
Number of major isoforms |
Number of additional isoforms |
Number of all proteins |
Number of amino acids |
Min. Seq. Length |
Max. Seq. Length |
Avg. Seq. Length |
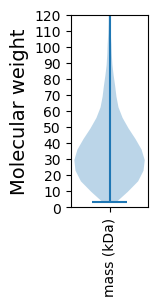
Avg. Mol. Weight |
|---|---|---|---|---|---|---|---|
0 |
1183161 |
28 |
6465 |
355.9 |
38.65 |
Amino acid frequency
Ala |
Cys |
Asp |
Glu |
Phe |
Gly |
His |
Ile |
Lys |
Leu |
|---|---|---|---|---|---|---|---|---|---|
12.418 ± 0.073 | 0.922 ± 0.016 |
5.234 ± 0.036 | 5.06 ± 0.036 |
3.245 ± 0.025 | 8.249 ± 0.044 |
2.529 ± 0.031 | 3.8 ± 0.028 |
3.182 ± 0.044 | 10.878 ± 0.056 |
Met |
Asn |
Gln |
Pro |
Arg |
Ser |
Thr |
Val |
Trp |
Tyr |
|---|---|---|---|---|---|---|---|---|---|
2.484 ± 0.023 | 2.63 ± 0.034 |
5.398 ± 0.043 | 4.868 ± 0.037 |
6.675 ± 0.052 | 5.497 ± 0.041 |
5.454 ± 0.058 | 7.852 ± 0.039 |
1.674 ± 0.024 | 1.95 ± 0.025 |
Most of the basic statistics you can see at this page can be downloaded from this CSV file
See this proteome in:

Proteome-pI is available under Creative Commons Attribution-NoDerivs license, for more details see here
| Reference: Kozlowski LP. Proteome-pI 2.0: Proteome Isoelectric Point Database Update. Nucleic Acids Res. 2021, doi: 10.1093/nar/gkab944 | Contact: Lukasz P. Kozlowski |