Naasia lichenicola
Taxonomy: cellular organisms; Bacteria; Terrabacteria group; Actinobacteria; Actinomycetia; Micrococcales; Microbacteriaceae; Naasia
Average proteome isoelectric point is 5.98
Get precalculated fractions of proteins
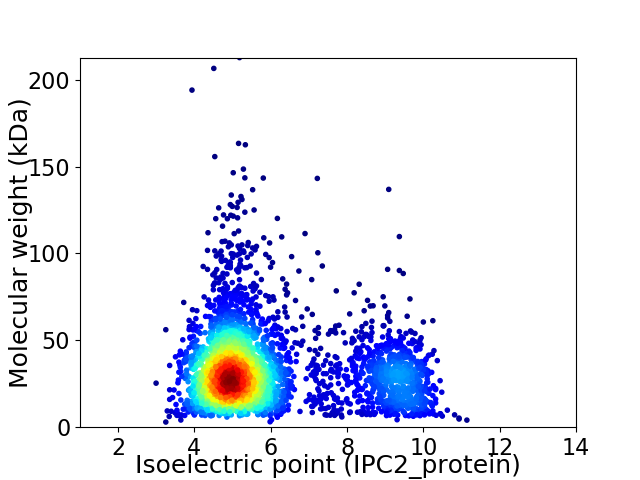
Virtual 2D-PAGE plot for 3498 proteins (isoelectric point calculated using IPC2_protein)
Get csv file with sequences according to given criteria:
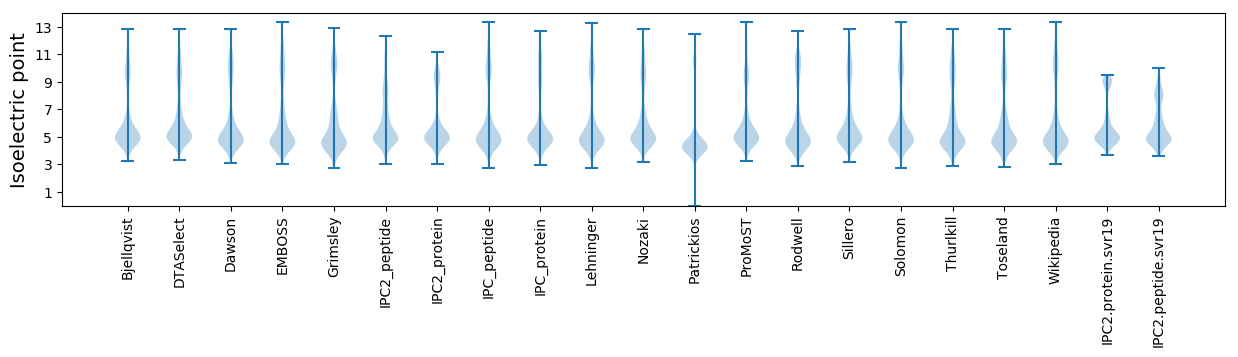
* You can choose from 21 different methods for calculating isoelectric point
Summary statistics related to proteome-wise predictions
Protein with the lowest isoelectric point:
>tr|A0A4S4FIG4|A0A4S4FIG4_9MICO Uncharacterized protein OS=Naasia lichenicola OX=2565933 GN=E6C64_13235 PE=4 SV=1
MM1 pKa = 7.77SGFEE5 pKa = 3.89KK6 pKa = 10.76AKK8 pKa = 10.34ASRR11 pKa = 11.84SRR13 pKa = 11.84TLKK16 pKa = 10.56NVLGGVAVIGVSVLFLSACSPTASTGSSEE45 pKa = 4.27TAAPPTDD52 pKa = 4.48DD53 pKa = 3.87LTLKK57 pKa = 10.43IGTALPQTGNLAYY70 pKa = 10.61LGPPEE75 pKa = 4.13EE76 pKa = 5.76AGVQYY81 pKa = 10.73AISEE85 pKa = 4.37INAATADD92 pKa = 3.39TGLTVDD98 pKa = 4.65LTLGDD103 pKa = 5.43SGDD106 pKa = 4.03TDD108 pKa = 3.11NKK110 pKa = 10.74AYY112 pKa = 8.31EE113 pKa = 4.24TEE115 pKa = 3.95IPRR118 pKa = 11.84LLGDD122 pKa = 3.91GVSAIIGAASSGTSLKK138 pKa = 10.9FIDD141 pKa = 4.45DD142 pKa = 3.73VVGAGVIQFSPANTSDD158 pKa = 3.9AFTTYY163 pKa = 10.71DD164 pKa = 4.0DD165 pKa = 3.44KK166 pKa = 11.81GLYY169 pKa = 9.82FRR171 pKa = 11.84TAPSDD176 pKa = 3.66VLQGEE181 pKa = 4.54VLGNLIAEE189 pKa = 5.36DD190 pKa = 4.32GNQTLGLIVLNDD202 pKa = 3.48SYY204 pKa = 11.65GTGLAKK210 pKa = 10.55YY211 pKa = 8.76VTDD214 pKa = 3.48SFEE217 pKa = 4.05AAGGEE222 pKa = 4.58VVAAPTYY229 pKa = 8.88NTGDD233 pKa = 3.41TSFDD237 pKa = 3.52SQIQEE242 pKa = 4.12VLAADD247 pKa = 4.23PDD249 pKa = 4.68AIALITFEE257 pKa = 4.29EE258 pKa = 5.0VKK260 pKa = 10.26TILPGLLASFPSDD273 pKa = 2.34KK274 pKa = 11.01LYY276 pKa = 10.88FVDD279 pKa = 5.61GNLKK283 pKa = 10.48NFGDD287 pKa = 4.21EE288 pKa = 4.34LPAGSLTGAKK298 pKa = 8.09GTLPGLSIDD307 pKa = 3.98SLTDD311 pKa = 3.22FTGALDD317 pKa = 4.53DD318 pKa = 4.25FASSEE323 pKa = 4.1GLPALKK329 pKa = 10.16DD330 pKa = 3.35YY331 pKa = 11.24SYY333 pKa = 11.43AAEE336 pKa = 4.55SYY338 pKa = 10.77DD339 pKa = 3.52ATVLLALGALAAGSTDD355 pKa = 3.19GTDD358 pKa = 2.92IAGKK362 pKa = 9.03LQEE365 pKa = 4.15VSGGSGDD372 pKa = 3.98GEE374 pKa = 4.44KK375 pKa = 9.99CTTYY379 pKa = 11.08ADD381 pKa = 3.61CAAIIVGGGTADD393 pKa = 3.39YY394 pKa = 10.88DD395 pKa = 4.59GISGPISFDD404 pKa = 4.37DD405 pKa = 4.26VGDD408 pKa = 4.1PQDD411 pKa = 3.49ASIGIYY417 pKa = 10.52VYY419 pKa = 11.18GEE421 pKa = 4.17DD422 pKa = 3.76NNYY425 pKa = 8.04TAYY428 pKa = 10.26EE429 pKa = 4.27GG430 pKa = 3.63
MM1 pKa = 7.77SGFEE5 pKa = 3.89KK6 pKa = 10.76AKK8 pKa = 10.34ASRR11 pKa = 11.84SRR13 pKa = 11.84TLKK16 pKa = 10.56NVLGGVAVIGVSVLFLSACSPTASTGSSEE45 pKa = 4.27TAAPPTDD52 pKa = 4.48DD53 pKa = 3.87LTLKK57 pKa = 10.43IGTALPQTGNLAYY70 pKa = 10.61LGPPEE75 pKa = 4.13EE76 pKa = 5.76AGVQYY81 pKa = 10.73AISEE85 pKa = 4.37INAATADD92 pKa = 3.39TGLTVDD98 pKa = 4.65LTLGDD103 pKa = 5.43SGDD106 pKa = 4.03TDD108 pKa = 3.11NKK110 pKa = 10.74AYY112 pKa = 8.31EE113 pKa = 4.24TEE115 pKa = 3.95IPRR118 pKa = 11.84LLGDD122 pKa = 3.91GVSAIIGAASSGTSLKK138 pKa = 10.9FIDD141 pKa = 4.45DD142 pKa = 3.73VVGAGVIQFSPANTSDD158 pKa = 3.9AFTTYY163 pKa = 10.71DD164 pKa = 4.0DD165 pKa = 3.44KK166 pKa = 11.81GLYY169 pKa = 9.82FRR171 pKa = 11.84TAPSDD176 pKa = 3.66VLQGEE181 pKa = 4.54VLGNLIAEE189 pKa = 5.36DD190 pKa = 4.32GNQTLGLIVLNDD202 pKa = 3.48SYY204 pKa = 11.65GTGLAKK210 pKa = 10.55YY211 pKa = 8.76VTDD214 pKa = 3.48SFEE217 pKa = 4.05AAGGEE222 pKa = 4.58VVAAPTYY229 pKa = 8.88NTGDD233 pKa = 3.41TSFDD237 pKa = 3.52SQIQEE242 pKa = 4.12VLAADD247 pKa = 4.23PDD249 pKa = 4.68AIALITFEE257 pKa = 4.29EE258 pKa = 5.0VKK260 pKa = 10.26TILPGLLASFPSDD273 pKa = 2.34KK274 pKa = 11.01LYY276 pKa = 10.88FVDD279 pKa = 5.61GNLKK283 pKa = 10.48NFGDD287 pKa = 4.21EE288 pKa = 4.34LPAGSLTGAKK298 pKa = 8.09GTLPGLSIDD307 pKa = 3.98SLTDD311 pKa = 3.22FTGALDD317 pKa = 4.53DD318 pKa = 4.25FASSEE323 pKa = 4.1GLPALKK329 pKa = 10.16DD330 pKa = 3.35YY331 pKa = 11.24SYY333 pKa = 11.43AAEE336 pKa = 4.55SYY338 pKa = 10.77DD339 pKa = 3.52ATVLLALGALAAGSTDD355 pKa = 3.19GTDD358 pKa = 2.92IAGKK362 pKa = 9.03LQEE365 pKa = 4.15VSGGSGDD372 pKa = 3.98GEE374 pKa = 4.44KK375 pKa = 9.99CTTYY379 pKa = 11.08ADD381 pKa = 3.61CAAIIVGGGTADD393 pKa = 3.39YY394 pKa = 10.88DD395 pKa = 4.59GISGPISFDD404 pKa = 4.37DD405 pKa = 4.26VGDD408 pKa = 4.1PQDD411 pKa = 3.49ASIGIYY417 pKa = 10.52VYY419 pKa = 11.18GEE421 pKa = 4.17DD422 pKa = 3.76NNYY425 pKa = 8.04TAYY428 pKa = 10.26EE429 pKa = 4.27GG430 pKa = 3.63
Molecular weight: 43.75 kDa
Isoelectric point according different methods:
Protein with the highest isoelectric point:
>tr|A0A4S4FP30|A0A4S4FP30_9MICO NAD-dependent epimerase/dehydratase family protein OS=Naasia lichenicola OX=2565933 GN=E6C64_04745 PE=3 SV=1
MM1 pKa = 7.4GSVIKK6 pKa = 10.42KK7 pKa = 8.47RR8 pKa = 11.84RR9 pKa = 11.84KK10 pKa = 9.22RR11 pKa = 11.84MAKK14 pKa = 9.41KK15 pKa = 9.87KK16 pKa = 9.7HH17 pKa = 5.84RR18 pKa = 11.84KK19 pKa = 8.56LLRR22 pKa = 11.84KK23 pKa = 7.78TRR25 pKa = 11.84HH26 pKa = 3.65QRR28 pKa = 11.84RR29 pKa = 11.84NKK31 pKa = 9.78KK32 pKa = 9.85
MM1 pKa = 7.4GSVIKK6 pKa = 10.42KK7 pKa = 8.47RR8 pKa = 11.84RR9 pKa = 11.84KK10 pKa = 9.22RR11 pKa = 11.84MAKK14 pKa = 9.41KK15 pKa = 9.87KK16 pKa = 9.7HH17 pKa = 5.84RR18 pKa = 11.84KK19 pKa = 8.56LLRR22 pKa = 11.84KK23 pKa = 7.78TRR25 pKa = 11.84HH26 pKa = 3.65QRR28 pKa = 11.84RR29 pKa = 11.84NKK31 pKa = 9.78KK32 pKa = 9.85
Molecular weight: 4.08 kDa
Isoelectric point according different methods:
Peptides (in silico digests for buttom-up proteomics)
Below you can find in silico digests of the whole proteome with Trypsin, Chymotrypsin, Trypsin+LysC, LysN, ArgC proteases suitable for different mass spec machines.| Try ESI |
 |
|---|
| ChTry ESI |
|
|---|
| ArgC ESI |
|
|---|
| LysN ESI |
|
|---|
| TryLysC ESI |
|
|---|
| Try MALDI |
|
|---|
| ChTry MALDI |
|
|---|
| ArgC MALDI |
|
|---|
| LysN MALDI |
|
|---|
| TryLysC MALDI |
|
|---|
| Try LTQ |
|
|---|
| ChTry LTQ |
|
|---|
| ArgC LTQ |
|
|---|
| LysN LTQ |
|
|---|
| TryLysC LTQ |
|
|---|
| Try MSlow |
|
|---|
| ChTry MSlow |
|
|---|
| ArgC MSlow |
|
|---|
| LysN MSlow |
|
|---|
| TryLysC MSlow |
|
|---|
| Try MShigh |
|
|---|
| ChTry MShigh |
|
|---|
| ArgC MShigh |
|
|---|
| LysN MShigh |
|
|---|
| TryLysC MShigh |
|
|---|
General Statistics
Number of major isoforms |
Number of additional isoforms |
Number of all proteins |
Number of amino acids |
Min. Seq. Length |
Max. Seq. Length |
Avg. Seq. Length |
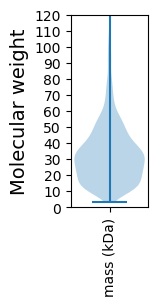
Avg. Mol. Weight |
|---|---|---|---|---|---|---|---|
0 |
1124881 |
27 |
2031 |
321.6 |
34.34 |
Amino acid frequency
Ala |
Cys |
Asp |
Glu |
Phe |
Gly |
His |
Ile |
Lys |
Leu |
|---|---|---|---|---|---|---|---|---|---|
13.084 ± 0.052 | 0.451 ± 0.009 |
6.246 ± 0.038 | 5.461 ± 0.041 |
3.177 ± 0.025 | 8.996 ± 0.036 |
1.889 ± 0.023 | 4.973 ± 0.031 |
1.974 ± 0.027 | 10.205 ± 0.053 |
Met |
Asn |
Gln |
Pro |
Arg |
Ser |
Thr |
Val |
Trp |
Tyr |
|---|---|---|---|---|---|---|---|---|---|
1.746 ± 0.015 | 1.992 ± 0.023 |
5.376 ± 0.034 | 2.81 ± 0.021 |
7.108 ± 0.047 | 6.501 ± 0.035 |
6.024 ± 0.041 | 8.584 ± 0.036 |
1.412 ± 0.018 | 1.991 ± 0.021 |
Most of the basic statistics you can see at this page can be downloaded from this CSV file
See this proteome in:

Proteome-pI is available under Creative Commons Attribution-NoDerivs license, for more details see here
| Reference: Kozlowski LP. Proteome-pI 2.0: Proteome Isoelectric Point Database Update. Nucleic Acids Res. 2021, doi: 10.1093/nar/gkab944 | Contact: Lukasz P. Kozlowski |