Streptococcus phage 11865
Taxonomy: Viruses; Duplodnaviria; Heunggongvirae; Uroviricota; Caudoviricetes; Caudovirales; Siphoviridae; unclassified Siphoviridae
Average proteome isoelectric point is 6.2
Get precalculated fractions of proteins
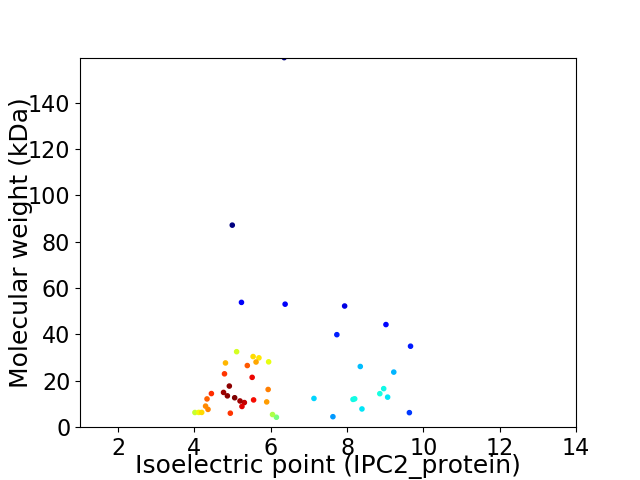
Virtual 2D-PAGE plot for 48 proteins (isoelectric point calculated using IPC2_protein)
Get csv file with sequences according to given criteria:
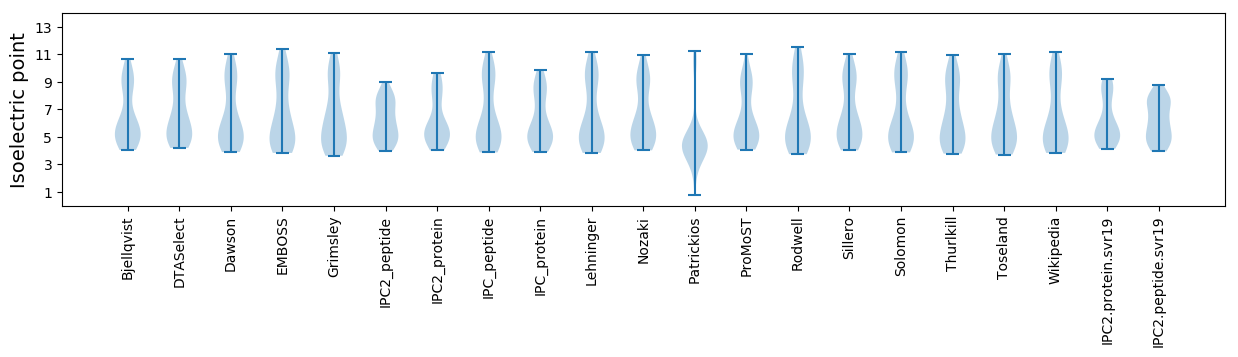
* You can choose from 21 different methods for calculating isoelectric point
Summary statistics related to proteome-wise predictions
Protein with the lowest isoelectric point:
>tr|E8ZDQ8|E8ZDQ8_9CAUD Phage protein OS=Streptococcus phage 11865 OX=870473 PE=4 SV=1
MM1 pKa = 7.92KK2 pKa = 10.19EE3 pKa = 3.58ILEE6 pKa = 4.43EE7 pKa = 3.94NLEE10 pKa = 4.11ASHH13 pKa = 7.68DD14 pKa = 4.04YY15 pKa = 10.94TSVLVVSLDD24 pKa = 3.24KK25 pKa = 11.36DD26 pKa = 3.74GEE28 pKa = 4.37INLGYY33 pKa = 10.32SWDD36 pKa = 3.9SSLQALGMLDD46 pKa = 3.33VAKK49 pKa = 10.77NYY51 pKa = 9.72ILNVINN57 pKa = 4.36
MM1 pKa = 7.92KK2 pKa = 10.19EE3 pKa = 3.58ILEE6 pKa = 4.43EE7 pKa = 3.94NLEE10 pKa = 4.11ASHH13 pKa = 7.68DD14 pKa = 4.04YY15 pKa = 10.94TSVLVVSLDD24 pKa = 3.24KK25 pKa = 11.36DD26 pKa = 3.74GEE28 pKa = 4.37INLGYY33 pKa = 10.32SWDD36 pKa = 3.9SSLQALGMLDD46 pKa = 3.33VAKK49 pKa = 10.77NYY51 pKa = 9.72ILNVINN57 pKa = 4.36
Molecular weight: 6.37 kDa
Isoelectric point according different methods:
Protein with the highest isoelectric point:
>tr|E8ZDQ1|E8ZDQ1_9CAUD Phage protein OS=Streptococcus phage 11865 OX=870473 PE=4 SV=1
MM1 pKa = 7.49QGILRR6 pKa = 11.84EE7 pKa = 4.05KK8 pKa = 9.96GQGIAEE14 pKa = 4.08RR15 pKa = 11.84AGEE18 pKa = 4.24GFEE21 pKa = 4.43LTVSPGQKK29 pKa = 9.27RR30 pKa = 11.84ANAKK34 pKa = 10.11ISTTDD39 pKa = 3.02IKK41 pKa = 11.66SMARR45 pKa = 11.84NKK47 pKa = 9.84KK48 pKa = 9.99HH49 pKa = 6.79NILLKK54 pKa = 10.84AMRR57 pKa = 4.66
MM1 pKa = 7.49QGILRR6 pKa = 11.84EE7 pKa = 4.05KK8 pKa = 9.96GQGIAEE14 pKa = 4.08RR15 pKa = 11.84AGEE18 pKa = 4.24GFEE21 pKa = 4.43LTVSPGQKK29 pKa = 9.27RR30 pKa = 11.84ANAKK34 pKa = 10.11ISTTDD39 pKa = 3.02IKK41 pKa = 11.66SMARR45 pKa = 11.84NKK47 pKa = 9.84KK48 pKa = 9.99HH49 pKa = 6.79NILLKK54 pKa = 10.84AMRR57 pKa = 4.66
Molecular weight: 6.28 kDa
Isoelectric point according different methods:
Peptides (in silico digests for buttom-up proteomics)
Below you can find in silico digests of the whole proteome with Trypsin, Chymotrypsin, Trypsin+LysC, LysN, ArgC proteases suitable for different mass spec machines.| Try ESI |
 |
|---|
| ChTry ESI |
|
|---|
| ArgC ESI |
|
|---|
| LysN ESI |
|
|---|
| TryLysC ESI |
|
|---|
| Try MALDI |
|
|---|
| ChTry MALDI |
|
|---|
| ArgC MALDI |
|
|---|
| LysN MALDI |
|
|---|
| TryLysC MALDI |
|
|---|
| Try LTQ |
|
|---|
| ChTry LTQ |
|
|---|
| ArgC LTQ |
|
|---|
| LysN LTQ |
|
|---|
| TryLysC LTQ |
|
|---|
| Try MSlow |
|
|---|
| ChTry MSlow |
|
|---|
| ArgC MSlow |
|
|---|
| LysN MSlow |
|
|---|
| TryLysC MSlow |
|
|---|
| Try MShigh |
|
|---|
| ChTry MShigh |
|
|---|
| ArgC MShigh |
|
|---|
| LysN MShigh |
|
|---|
| TryLysC MShigh |
|
|---|
General Statistics
Number of major isoforms |
Number of additional isoforms |
Number of all proteins |
Number of amino acids |
Min. Seq. Length |
Max. Seq. Length |
Avg. Seq. Length |
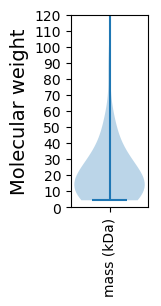
Avg. Mol. Weight |
|---|---|---|---|---|---|---|---|
0 |
9971 |
38 |
1421 |
207.7 |
23.53 |
Amino acid frequency
Ala |
Cys |
Asp |
Glu |
Phe |
Gly |
His |
Ile |
Lys |
Leu |
|---|---|---|---|---|---|---|---|---|---|
6.73 ± 0.418 | 0.652 ± 0.111 |
5.897 ± 0.282 | 7.632 ± 0.509 |
4.313 ± 0.254 | 7.101 ± 0.474 |
1.524 ± 0.165 | 6.92 ± 0.382 |
8.093 ± 0.433 | 8.194 ± 0.329 |
Met |
Asn |
Gln |
Pro |
Arg |
Ser |
Thr |
Val |
Trp |
Tyr |
|---|---|---|---|---|---|---|---|---|---|
2.467 ± 0.197 | 5.596 ± 0.331 |
2.708 ± 0.286 | 3.961 ± 0.18 |
4.684 ± 0.322 | 6.429 ± 0.373 |
5.626 ± 0.306 | 6.027 ± 0.283 |
1.494 ± 0.177 | 3.951 ± 0.245 |
Most of the basic statistics you can see at this page can be downloaded from this CSV file
See this proteome in:

Proteome-pI is available under Creative Commons Attribution-NoDerivs license, for more details see here
| Reference: Kozlowski LP. Proteome-pI 2.0: Proteome Isoelectric Point Database Update. Nucleic Acids Res. 2021, doi: 10.1093/nar/gkab944 | Contact: Lukasz P. Kozlowski |