archaeon HR06
Taxonomy: cellular organisms; Archaea; unclassified Archaea
Average proteome isoelectric point is 7.48
Get precalculated fractions of proteins
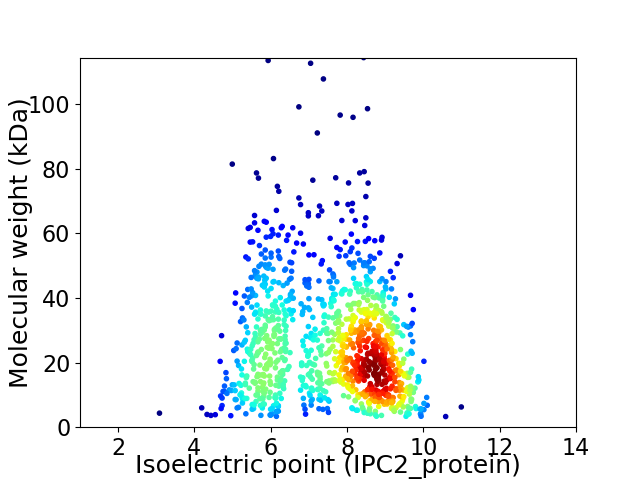
Virtual 2D-PAGE plot for 1118 proteins (isoelectric point calculated using IPC2_protein)
Get csv file with sequences according to given criteria:
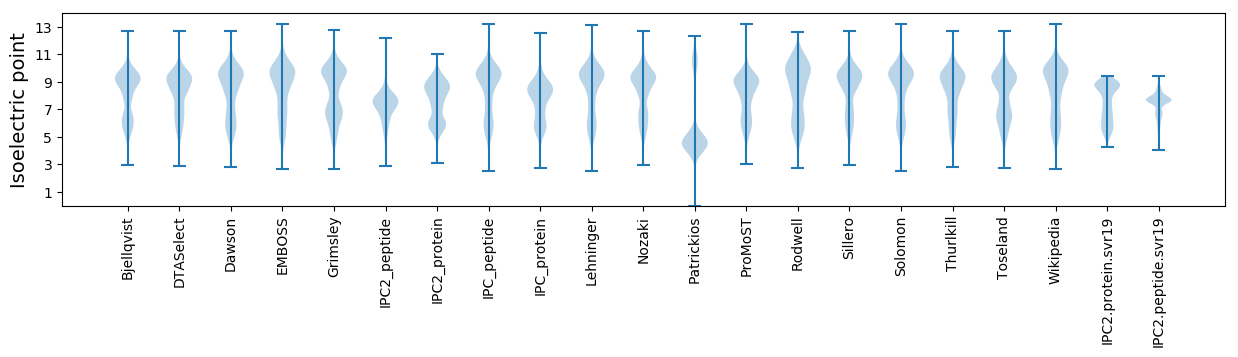
* You can choose from 21 different methods for calculating isoelectric point
Summary statistics related to proteome-wise predictions
Protein with the lowest isoelectric point:
>tr|A0A2H5VFK0|A0A2H5VFK0_9ARCH Inner membrane ABC transporter permease protein YcjP OS=archaeon HR06 OX=2035442 GN=ycjP_4 PE=3 SV=1
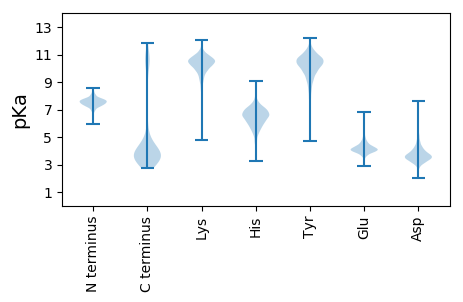
MM1 pKa = 7.89SLEE4 pKa = 4.47CLDD7 pKa = 4.36CGGSIKK13 pKa = 10.23IPKK16 pKa = 9.28DD17 pKa = 3.61AIAGEE22 pKa = 4.48VLTCPDD28 pKa = 4.2CGSSFEE34 pKa = 4.33LVKK37 pKa = 10.88DD38 pKa = 3.71EE39 pKa = 5.64KK40 pKa = 11.32GFSLKK45 pKa = 10.02FAQVEE50 pKa = 4.32GEE52 pKa = 4.2DD53 pKa = 3.28WGEE56 pKa = 3.68
MM1 pKa = 7.89SLEE4 pKa = 4.47CLDD7 pKa = 4.36CGGSIKK13 pKa = 10.23IPKK16 pKa = 9.28DD17 pKa = 3.61AIAGEE22 pKa = 4.48VLTCPDD28 pKa = 4.2CGSSFEE34 pKa = 4.33LVKK37 pKa = 10.88DD38 pKa = 3.71EE39 pKa = 5.64KK40 pKa = 11.32GFSLKK45 pKa = 10.02FAQVEE50 pKa = 4.32GEE52 pKa = 4.2DD53 pKa = 3.28WGEE56 pKa = 3.68
Molecular weight: 5.98 kDa
Isoelectric point according different methods:
Protein with the highest isoelectric point:
>tr|A0A2H5VEL1|A0A2H5VEL1_9ARCH Bifunctional protein HldE OS=archaeon HR06 OX=2035442 GN=hldE_1 PE=4 SV=1
MM1 pKa = 7.15PTHH4 pKa = 6.98GSLTKK9 pKa = 10.14AGKK12 pKa = 9.72VRR14 pKa = 11.84SQTPKK19 pKa = 8.54IPARR23 pKa = 11.84PRR25 pKa = 11.84HH26 pKa = 5.32SPIPKK31 pKa = 9.21VRR33 pKa = 11.84LKK35 pKa = 11.05SIFVKK40 pKa = 10.65RR41 pKa = 11.84NILKK45 pKa = 10.4RR46 pKa = 11.84KK47 pKa = 9.19PGQNWINVV55 pKa = 3.56
MM1 pKa = 7.15PTHH4 pKa = 6.98GSLTKK9 pKa = 10.14AGKK12 pKa = 9.72VRR14 pKa = 11.84SQTPKK19 pKa = 8.54IPARR23 pKa = 11.84PRR25 pKa = 11.84HH26 pKa = 5.32SPIPKK31 pKa = 9.21VRR33 pKa = 11.84LKK35 pKa = 11.05SIFVKK40 pKa = 10.65RR41 pKa = 11.84NILKK45 pKa = 10.4RR46 pKa = 11.84KK47 pKa = 9.19PGQNWINVV55 pKa = 3.56
Molecular weight: 6.26 kDa
Isoelectric point according different methods:
Peptides (in silico digests for buttom-up proteomics)
Below you can find in silico digests of the whole proteome with Trypsin, Chymotrypsin, Trypsin+LysC, LysN, ArgC proteases suitable for different mass spec machines.| Try ESI |
 |
|---|
| ChTry ESI |
|
|---|
| ArgC ESI |
|
|---|
| LysN ESI |
|
|---|
| TryLysC ESI |
|
|---|
| Try MALDI |
|
|---|
| ChTry MALDI |
|
|---|
| ArgC MALDI |
|
|---|
| LysN MALDI |
|
|---|
| TryLysC MALDI |
|
|---|
| Try LTQ |
|
|---|
| ChTry LTQ |
|
|---|
| ArgC LTQ |
|
|---|
| LysN LTQ |
|
|---|
| TryLysC LTQ |
|
|---|
| Try MSlow |
|
|---|
| ChTry MSlow |
|
|---|
| ArgC MSlow |
|
|---|
| LysN MSlow |
|
|---|
| TryLysC MSlow |
|
|---|
| Try MShigh |
|
|---|
| ChTry MShigh |
|
|---|
| ArgC MShigh |
|
|---|
| LysN MShigh |
|
|---|
| TryLysC MShigh |
|
|---|
General Statistics
Number of major isoforms |
Number of additional isoforms |
Number of all proteins |
Number of amino acids |
Min. Seq. Length |
Max. Seq. Length |
Avg. Seq. Length |
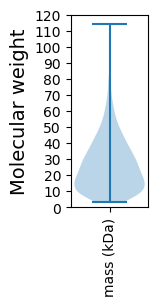
Avg. Mol. Weight |
|---|---|---|---|---|---|---|---|
0 |
263615 |
29 |
1009 |
235.8 |
26.83 |
Amino acid frequency
Ala |
Cys |
Asp |
Glu |
Phe |
Gly |
His |
Ile |
Lys |
Leu |
|---|---|---|---|---|---|---|---|---|---|
5.583 ± 0.076 | 0.977 ± 0.032 |
4.762 ± 0.045 | 7.955 ± 0.081 |
4.81 ± 0.075 | 6.503 ± 0.058 |
1.303 ± 0.026 | 9.199 ± 0.069 |
9.522 ± 0.096 | 11.755 ± 0.11 |
Met |
Asn |
Gln |
Pro |
Arg |
Ser |
Thr |
Val |
Trp |
Tyr |
|---|---|---|---|---|---|---|---|---|---|
2.056 ± 0.03 | 4.132 ± 0.048 |
3.859 ± 0.052 | 1.676 ± 0.034 |
4.718 ± 0.055 | 5.926 ± 0.063 |
3.961 ± 0.074 | 6.284 ± 0.067 |
1.044 ± 0.034 | 3.974 ± 0.047 |
Most of the basic statistics you can see at this page can be downloaded from this CSV file
See this proteome in:

Proteome-pI is available under Creative Commons Attribution-NoDerivs license, for more details see here
| Reference: Kozlowski LP. Proteome-pI 2.0: Proteome Isoelectric Point Database Update. Nucleic Acids Res. 2021, doi: 10.1093/nar/gkab944 | Contact: Lukasz P. Kozlowski |