Streptococcus phage Javan509
Taxonomy: Viruses; Duplodnaviria; Heunggongvirae; Uroviricota; Caudoviricetes; Caudovirales; Siphoviridae; unclassified Siphoviridae
Average proteome isoelectric point is 6.42
Get precalculated fractions of proteins
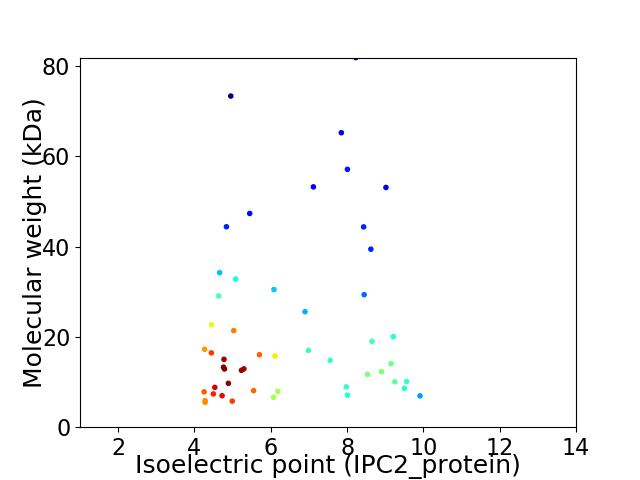
Virtual 2D-PAGE plot for 51 proteins (isoelectric point calculated using IPC2_protein)
Get csv file with sequences according to given criteria:
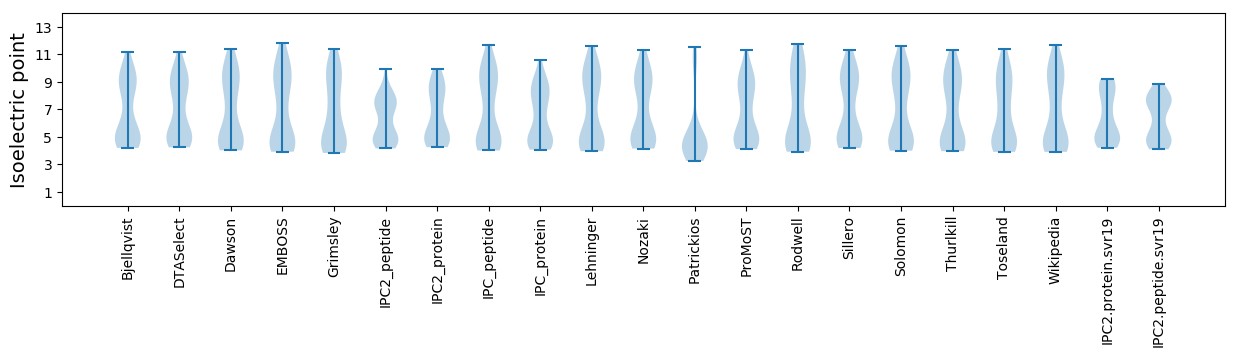
* You can choose from 21 different methods for calculating isoelectric point
Summary statistics related to proteome-wise predictions
Protein with the lowest isoelectric point:
>tr|A0A4D6AK41|A0A4D6AK41_9CAUD Uncharacterized protein OS=Streptococcus phage Javan509 OX=2548222 GN=Javan509_0042 PE=4 SV=1
MM1 pKa = 7.89IEE3 pKa = 4.22LTQKK7 pKa = 9.53QADD10 pKa = 3.73YY11 pKa = 11.45VEE13 pKa = 5.18FVRR16 pKa = 11.84KK17 pKa = 8.37TIVDD21 pKa = 3.65PDD23 pKa = 3.48MMEE26 pKa = 4.18FAVNTQLISYY36 pKa = 8.87ALLVGYY42 pKa = 9.09CIVDD46 pKa = 3.6EE47 pKa = 4.67EE48 pKa = 4.57VAKK51 pKa = 10.96
MM1 pKa = 7.89IEE3 pKa = 4.22LTQKK7 pKa = 9.53QADD10 pKa = 3.73YY11 pKa = 11.45VEE13 pKa = 5.18FVRR16 pKa = 11.84KK17 pKa = 8.37TIVDD21 pKa = 3.65PDD23 pKa = 3.48MMEE26 pKa = 4.18FAVNTQLISYY36 pKa = 8.87ALLVGYY42 pKa = 9.09CIVDD46 pKa = 3.6EE47 pKa = 4.67EE48 pKa = 4.57VAKK51 pKa = 10.96
Molecular weight: 5.87 kDa
Isoelectric point according different methods:
Protein with the highest isoelectric point:
>tr|A0A4D6AIM3|A0A4D6AIM3_9CAUD Hyaluronidase OS=Streptococcus phage Javan509 OX=2548222 GN=Javan509_0007 PE=4 SV=1
MM1 pKa = 7.4NKK3 pKa = 10.29LEE5 pKa = 4.69LFLLATTVILAVIARR20 pKa = 11.84VQHH23 pKa = 5.44EE24 pKa = 4.77VIKK27 pKa = 10.66KK28 pKa = 9.96HH29 pKa = 5.97NSPEE33 pKa = 3.91NKK35 pKa = 9.18RR36 pKa = 11.84KK37 pKa = 9.67IFRR40 pKa = 11.84EE41 pKa = 4.02VALKK45 pKa = 10.61NSKK48 pKa = 9.36GWSKK52 pKa = 10.54KK53 pKa = 7.07RR54 pKa = 11.84ARR56 pKa = 11.84GGVVSS61 pKa = 4.31
MM1 pKa = 7.4NKK3 pKa = 10.29LEE5 pKa = 4.69LFLLATTVILAVIARR20 pKa = 11.84VQHH23 pKa = 5.44EE24 pKa = 4.77VIKK27 pKa = 10.66KK28 pKa = 9.96HH29 pKa = 5.97NSPEE33 pKa = 3.91NKK35 pKa = 9.18RR36 pKa = 11.84KK37 pKa = 9.67IFRR40 pKa = 11.84EE41 pKa = 4.02VALKK45 pKa = 10.61NSKK48 pKa = 9.36GWSKK52 pKa = 10.54KK53 pKa = 7.07RR54 pKa = 11.84ARR56 pKa = 11.84GGVVSS61 pKa = 4.31
Molecular weight: 6.94 kDa
Isoelectric point according different methods:
Peptides (in silico digests for buttom-up proteomics)
Below you can find in silico digests of the whole proteome with Trypsin, Chymotrypsin, Trypsin+LysC, LysN, ArgC proteases suitable for different mass spec machines.| Try ESI |
 |
|---|
| ChTry ESI |
|
|---|
| ArgC ESI |
|
|---|
| LysN ESI |
|
|---|
| TryLysC ESI |
|
|---|
| Try MALDI |
|
|---|
| ChTry MALDI |
|
|---|
| ArgC MALDI |
|
|---|
| LysN MALDI |
|
|---|
| TryLysC MALDI |
|
|---|
| Try LTQ |
|
|---|
| ChTry LTQ |
|
|---|
| ArgC LTQ |
|
|---|
| LysN LTQ |
|
|---|
| TryLysC LTQ |
|
|---|
| Try MSlow |
|
|---|
| ChTry MSlow |
|
|---|
| ArgC MSlow |
|
|---|
| LysN MSlow |
|
|---|
| TryLysC MSlow |
|
|---|
| Try MShigh |
|
|---|
| ChTry MShigh |
|
|---|
| ArgC MShigh |
|
|---|
| LysN MShigh |
|
|---|
| TryLysC MShigh |
|
|---|
General Statistics
Number of major isoforms |
Number of additional isoforms |
Number of all proteins |
Number of amino acids |
Min. Seq. Length |
Max. Seq. Length |
Avg. Seq. Length |
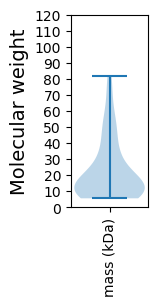
Avg. Mol. Weight |
|---|---|---|---|---|---|---|---|
0 |
10311 |
50 |
787 |
202.2 |
22.7 |
Amino acid frequency
Ala |
Cys |
Asp |
Glu |
Phe |
Gly |
His |
Ile |
Lys |
Leu |
|---|---|---|---|---|---|---|---|---|---|
7.439 ± 0.534 | 0.64 ± 0.111 |
6.605 ± 0.358 | 7.08 ± 0.549 |
3.967 ± 0.192 | 6.605 ± 0.462 |
1.309 ± 0.143 | 7.196 ± 0.202 |
9.398 ± 0.458 | 8.098 ± 0.322 |
Met |
Asn |
Gln |
Pro |
Arg |
Ser |
Thr |
Val |
Trp |
Tyr |
|---|---|---|---|---|---|---|---|---|---|
2.357 ± 0.155 | 5.295 ± 0.211 |
2.842 ± 0.205 | 3.802 ± 0.251 |
3.705 ± 0.312 | 6.517 ± 0.467 |
5.965 ± 0.192 | 6.255 ± 0.256 |
1.164 ± 0.126 | 3.763 ± 0.228 |
Most of the basic statistics you can see at this page can be downloaded from this CSV file
See this proteome in:

Proteome-pI is available under Creative Commons Attribution-NoDerivs license, for more details see here
| Reference: Kozlowski LP. Proteome-pI 2.0: Proteome Isoelectric Point Database Update. Nucleic Acids Res. 2021, doi: 10.1093/nar/gkab944 | Contact: Lukasz P. Kozlowski |