Bradyrhizobium phage BDU-MI-1
Taxonomy: Viruses; Duplodnaviria; Heunggongvirae; Uroviricota; Caudoviricetes; Caudovirales; Myoviridae; unclassified Myoviridae
Average proteome isoelectric point is 6.53
Get precalculated fractions of proteins
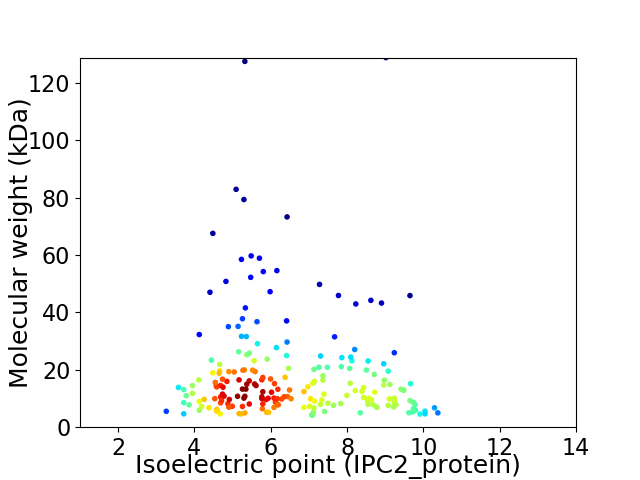
Virtual 2D-PAGE plot for 207 proteins (isoelectric point calculated using IPC2_protein)
Get csv file with sequences according to given criteria:
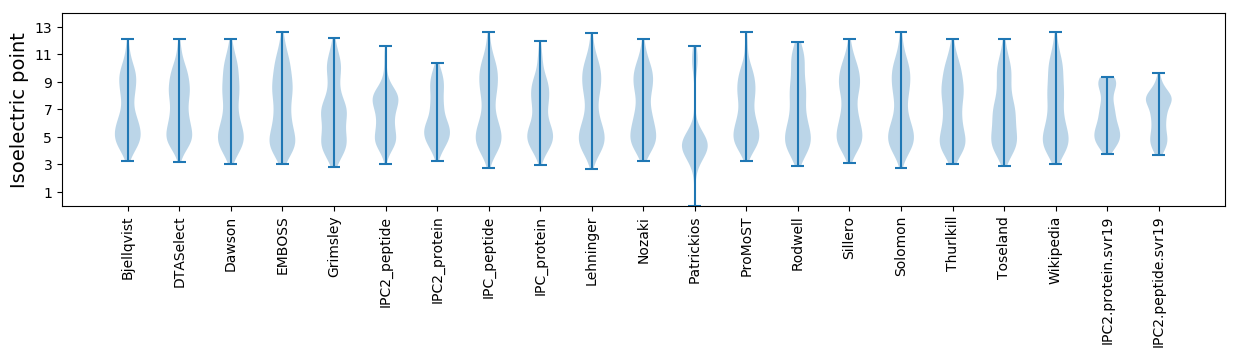
* You can choose from 21 different methods for calculating isoelectric point
Summary statistics related to proteome-wise predictions
Protein with the lowest isoelectric point:
>tr|A0A1X9SH41|A0A1X9SH41_9CAUD Uncharacterized protein OS=Bradyrhizobium phage BDU-MI-1 OX=1983459 PE=4 SV=1
MM1 pKa = 7.48SDD3 pKa = 3.53EE4 pKa = 3.99YY5 pKa = 10.9RR6 pKa = 11.84DD7 pKa = 3.59PGFVIDD13 pKa = 6.2LVTQTCVFDD22 pKa = 3.54TGFVCPIVTMLDD34 pKa = 3.26SRR36 pKa = 11.84GDD38 pKa = 3.38EE39 pKa = 3.97TLEE42 pKa = 4.11NEE44 pKa = 4.07EE45 pKa = 4.0AEE47 pKa = 4.52YY48 pKa = 11.06AVVRR52 pKa = 11.84VPPDD56 pKa = 3.5GLCITVDD63 pKa = 3.82LQALQEE69 pKa = 4.11EE70 pKa = 5.08GQLQIAHH77 pKa = 7.02
MM1 pKa = 7.48SDD3 pKa = 3.53EE4 pKa = 3.99YY5 pKa = 10.9RR6 pKa = 11.84DD7 pKa = 3.59PGFVIDD13 pKa = 6.2LVTQTCVFDD22 pKa = 3.54TGFVCPIVTMLDD34 pKa = 3.26SRR36 pKa = 11.84GDD38 pKa = 3.38EE39 pKa = 3.97TLEE42 pKa = 4.11NEE44 pKa = 4.07EE45 pKa = 4.0AEE47 pKa = 4.52YY48 pKa = 11.06AVVRR52 pKa = 11.84VPPDD56 pKa = 3.5GLCITVDD63 pKa = 3.82LQALQEE69 pKa = 4.11EE70 pKa = 5.08GQLQIAHH77 pKa = 7.02
Molecular weight: 8.55 kDa
Isoelectric point according different methods:
Protein with the highest isoelectric point:
>tr|A0A1X9SHF1|A0A1X9SHF1_9CAUD Uncharacterized protein OS=Bradyrhizobium phage BDU-MI-1 OX=1983459 PE=4 SV=1
MM1 pKa = 7.27LTLNKK6 pKa = 10.11LDD8 pKa = 3.52TAEE11 pKa = 4.22AHH13 pKa = 6.8ILHH16 pKa = 6.14QKK18 pKa = 9.82LSRR21 pKa = 11.84MWRR24 pKa = 11.84EE25 pKa = 3.05ADD27 pKa = 2.94EE28 pKa = 4.56AMARR32 pKa = 11.84RR33 pKa = 11.84AYY35 pKa = 11.24RR36 pKa = 11.84MMSRR40 pKa = 11.84IYY42 pKa = 10.53LHH44 pKa = 5.61IHH46 pKa = 4.6KK47 pKa = 9.45TMLRR51 pKa = 11.84SAA53 pKa = 4.21
MM1 pKa = 7.27LTLNKK6 pKa = 10.11LDD8 pKa = 3.52TAEE11 pKa = 4.22AHH13 pKa = 6.8ILHH16 pKa = 6.14QKK18 pKa = 9.82LSRR21 pKa = 11.84MWRR24 pKa = 11.84EE25 pKa = 3.05ADD27 pKa = 2.94EE28 pKa = 4.56AMARR32 pKa = 11.84RR33 pKa = 11.84AYY35 pKa = 11.24RR36 pKa = 11.84MMSRR40 pKa = 11.84IYY42 pKa = 10.53LHH44 pKa = 5.61IHH46 pKa = 4.6KK47 pKa = 9.45TMLRR51 pKa = 11.84SAA53 pKa = 4.21
Molecular weight: 6.4 kDa
Isoelectric point according different methods:
Peptides (in silico digests for buttom-up proteomics)
Below you can find in silico digests of the whole proteome with Trypsin, Chymotrypsin, Trypsin+LysC, LysN, ArgC proteases suitable for different mass spec machines.| Try ESI |
 |
|---|
| ChTry ESI |
|
|---|
| ArgC ESI |
|
|---|
| LysN ESI |
|
|---|
| TryLysC ESI |
|
|---|
| Try MALDI |
|
|---|
| ChTry MALDI |
|
|---|
| ArgC MALDI |
|
|---|
| LysN MALDI |
|
|---|
| TryLysC MALDI |
|
|---|
| Try LTQ |
|
|---|
| ChTry LTQ |
|
|---|
| ArgC LTQ |
|
|---|
| LysN LTQ |
|
|---|
| TryLysC LTQ |
|
|---|
| Try MSlow |
|
|---|
| ChTry MSlow |
|
|---|
| ArgC MSlow |
|
|---|
| LysN MSlow |
|
|---|
| TryLysC MSlow |
|
|---|
| Try MShigh |
|
|---|
| ChTry MShigh |
|
|---|
| ArgC MShigh |
|
|---|
| LysN MShigh |
|
|---|
| TryLysC MShigh |
|
|---|
General Statistics
Number of major isoforms |
Number of additional isoforms |
Number of all proteins |
Number of amino acids |
Min. Seq. Length |
Max. Seq. Length |
Avg. Seq. Length |
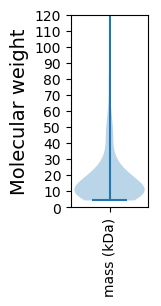
Avg. Mol. Weight |
|---|---|---|---|---|---|---|---|
0 |
35136 |
38 |
1212 |
169.7 |
18.83 |
Amino acid frequency
Ala |
Cys |
Asp |
Glu |
Phe |
Gly |
His |
Ile |
Lys |
Leu |
|---|---|---|---|---|---|---|---|---|---|
10.2 ± 0.249 | 1.201 ± 0.098 |
6.802 ± 0.168 | 6.233 ± 0.189 |
3.549 ± 0.112 | 7.645 ± 0.314 |
2.089 ± 0.108 | 5.399 ± 0.135 |
5.681 ± 0.207 | 7.616 ± 0.186 |
Met |
Asn |
Gln |
Pro |
Arg |
Ser |
Thr |
Val |
Trp |
Tyr |
|---|---|---|---|---|---|---|---|---|---|
2.809 ± 0.094 | 3.671 ± 0.147 |
4.79 ± 0.169 | 3.484 ± 0.12 |
6.338 ± 0.193 | 5.39 ± 0.186 |
5.612 ± 0.193 | 6.865 ± 0.155 |
1.827 ± 0.07 | 2.798 ± 0.111 |
Most of the basic statistics you can see at this page can be downloaded from this CSV file
See this proteome in:

Proteome-pI is available under Creative Commons Attribution-NoDerivs license, for more details see here
| Reference: Kozlowski LP. Proteome-pI 2.0: Proteome Isoelectric Point Database Update. Nucleic Acids Res. 2021, doi: 10.1093/nar/gkab944 | Contact: Lukasz P. Kozlowski |