Gluconobacter wancherniae NBRC 103581
Taxonomy: cellular organisms; Bacteria; Proteobacteria; Alphaproteobacteria; Rhodospirillales; Acetobacteraceae; Gluconobacter; Gluconobacter wancherniae
Average proteome isoelectric point is 6.5
Get precalculated fractions of proteins
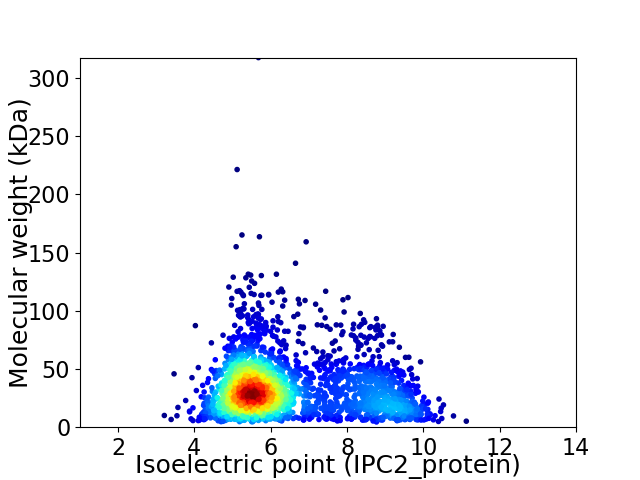
Virtual 2D-PAGE plot for 2573 proteins (isoelectric point calculated using IPC2_protein)
Get csv file with sequences according to given criteria:
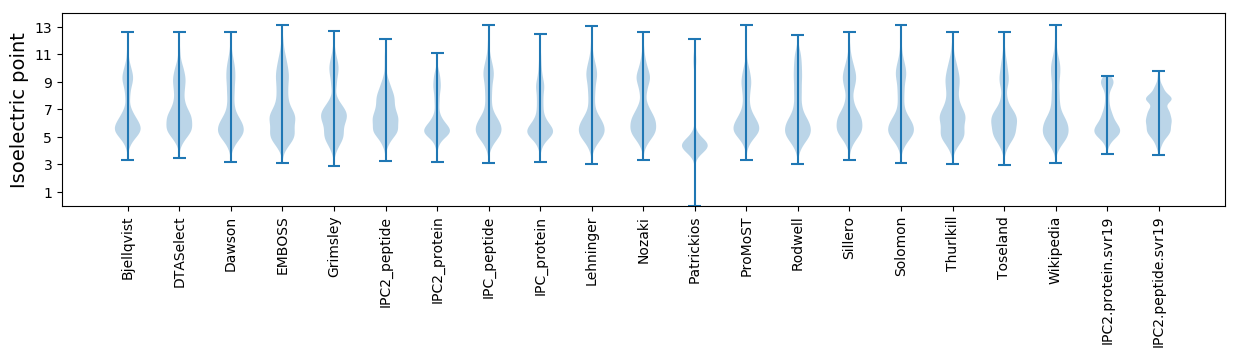
* You can choose from 21 different methods for calculating isoelectric point
Summary statistics related to proteome-wise predictions
Protein with the lowest isoelectric point:
>tr|A0A511B276|A0A511B276_9PROT AB hydrolase-1 domain-containing protein OS=Gluconobacter wancherniae NBRC 103581 OX=656744 GN=GWA01_23250 PE=4 SV=1
MM1 pKa = 7.51SIIGSVQTAVSGLNAQSHH19 pKa = 6.0AFSDD23 pKa = 4.2LSNNIANSQTVGYY36 pKa = 9.75KK37 pKa = 9.31ATTTSFADD45 pKa = 3.56YY46 pKa = 8.97VTNNSLVQDD55 pKa = 4.19GQSMSDD61 pKa = 3.12SVLATTRR68 pKa = 11.84QHH70 pKa = 6.64NDD72 pKa = 2.69NQGTVTASTNTLALAISGNGFFNVQQASGNSTGTAPVFNGQQYY115 pKa = 6.71YY116 pKa = 8.89TRR118 pKa = 11.84NGDD121 pKa = 3.64FSQDD125 pKa = 2.9ANGYY129 pKa = 9.44LKK131 pKa = 9.55NTSNYY136 pKa = 9.29YY137 pKa = 10.57LEE139 pKa = 6.16GYY141 pKa = 7.95QTDD144 pKa = 3.39SSGKK148 pKa = 9.22MSTTLAPIQIQNVAFRR164 pKa = 11.84PTQTTTMTVSSAIGSVGGTGQTSTTTATAYY194 pKa = 10.3DD195 pKa = 4.13SQGVAHH201 pKa = 7.06DD202 pKa = 4.81VSLTWTQTGTDD213 pKa = 3.12TWTVSNTADD222 pKa = 3.49PTNNTTVTFNDD233 pKa = 4.07DD234 pKa = 3.27GSLKK238 pKa = 10.45QVGNTTQATGATASFAFLGTPQNMTVSLGTIGSTSGVSLSSGTSSGATTSTMTTDD293 pKa = 2.8STTTGTYY300 pKa = 10.16SGIAIQSDD308 pKa = 4.17GSVMATFDD316 pKa = 3.54NGLSQLVAKK325 pKa = 10.47IPLTTFSNPNGLAAQDD341 pKa = 3.83GQAYY345 pKa = 6.79TATATSGSPSAPTAVNTNGAGTLDD369 pKa = 3.64VGSLEE374 pKa = 4.87SSTTDD379 pKa = 3.05LTSNLTQLIVDD390 pKa = 3.77QQAYY394 pKa = 8.88GANTKK399 pKa = 9.88VVTTANQMLQTTLAMIQQ416 pKa = 3.18
MM1 pKa = 7.51SIIGSVQTAVSGLNAQSHH19 pKa = 6.0AFSDD23 pKa = 4.2LSNNIANSQTVGYY36 pKa = 9.75KK37 pKa = 9.31ATTTSFADD45 pKa = 3.56YY46 pKa = 8.97VTNNSLVQDD55 pKa = 4.19GQSMSDD61 pKa = 3.12SVLATTRR68 pKa = 11.84QHH70 pKa = 6.64NDD72 pKa = 2.69NQGTVTASTNTLALAISGNGFFNVQQASGNSTGTAPVFNGQQYY115 pKa = 6.71YY116 pKa = 8.89TRR118 pKa = 11.84NGDD121 pKa = 3.64FSQDD125 pKa = 2.9ANGYY129 pKa = 9.44LKK131 pKa = 9.55NTSNYY136 pKa = 9.29YY137 pKa = 10.57LEE139 pKa = 6.16GYY141 pKa = 7.95QTDD144 pKa = 3.39SSGKK148 pKa = 9.22MSTTLAPIQIQNVAFRR164 pKa = 11.84PTQTTTMTVSSAIGSVGGTGQTSTTTATAYY194 pKa = 10.3DD195 pKa = 4.13SQGVAHH201 pKa = 7.06DD202 pKa = 4.81VSLTWTQTGTDD213 pKa = 3.12TWTVSNTADD222 pKa = 3.49PTNNTTVTFNDD233 pKa = 4.07DD234 pKa = 3.27GSLKK238 pKa = 10.45QVGNTTQATGATASFAFLGTPQNMTVSLGTIGSTSGVSLSSGTSSGATTSTMTTDD293 pKa = 2.8STTTGTYY300 pKa = 10.16SGIAIQSDD308 pKa = 4.17GSVMATFDD316 pKa = 3.54NGLSQLVAKK325 pKa = 10.47IPLTTFSNPNGLAAQDD341 pKa = 3.83GQAYY345 pKa = 6.79TATATSGSPSAPTAVNTNGAGTLDD369 pKa = 3.64VGSLEE374 pKa = 4.87SSTTDD379 pKa = 3.05LTSNLTQLIVDD390 pKa = 3.77QQAYY394 pKa = 8.88GANTKK399 pKa = 9.88VVTTANQMLQTTLAMIQQ416 pKa = 3.18
Molecular weight: 42.56 kDa
Isoelectric point according different methods:
Protein with the highest isoelectric point:
>tr|A0A511B4H6|A0A511B4H6_9PROT ABC export transporter fused inner membrane and ATPases OS=Gluconobacter wancherniae NBRC 103581 OX=656744 GN=GWA01_23920 PE=4 SV=1
MM1 pKa = 7.35KK2 pKa = 9.43RR3 pKa = 11.84TYY5 pKa = 10.27QPSKK9 pKa = 9.73LVRR12 pKa = 11.84KK13 pKa = 9.02RR14 pKa = 11.84RR15 pKa = 11.84HH16 pKa = 4.43GFRR19 pKa = 11.84TRR21 pKa = 11.84SATVGGRR28 pKa = 11.84RR29 pKa = 11.84VLANRR34 pKa = 11.84RR35 pKa = 11.84TKK37 pKa = 10.41GRR39 pKa = 11.84KK40 pKa = 8.93KK41 pKa = 10.59LSAA44 pKa = 3.95
MM1 pKa = 7.35KK2 pKa = 9.43RR3 pKa = 11.84TYY5 pKa = 10.27QPSKK9 pKa = 9.73LVRR12 pKa = 11.84KK13 pKa = 9.02RR14 pKa = 11.84RR15 pKa = 11.84HH16 pKa = 4.43GFRR19 pKa = 11.84TRR21 pKa = 11.84SATVGGRR28 pKa = 11.84RR29 pKa = 11.84VLANRR34 pKa = 11.84RR35 pKa = 11.84TKK37 pKa = 10.41GRR39 pKa = 11.84KK40 pKa = 8.93KK41 pKa = 10.59LSAA44 pKa = 3.95
Molecular weight: 5.17 kDa
Isoelectric point according different methods:
Peptides (in silico digests for buttom-up proteomics)
Below you can find in silico digests of the whole proteome with Trypsin, Chymotrypsin, Trypsin+LysC, LysN, ArgC proteases suitable for different mass spec machines.| Try ESI |
 |
|---|
| ChTry ESI |
|
|---|
| ArgC ESI |
|
|---|
| LysN ESI |
|
|---|
| TryLysC ESI |
|
|---|
| Try MALDI |
|
|---|
| ChTry MALDI |
|
|---|
| ArgC MALDI |
|
|---|
| LysN MALDI |
|
|---|
| TryLysC MALDI |
|
|---|
| Try LTQ |
|
|---|
| ChTry LTQ |
|
|---|
| ArgC LTQ |
|
|---|
| LysN LTQ |
|
|---|
| TryLysC LTQ |
|
|---|
| Try MSlow |
|
|---|
| ChTry MSlow |
|
|---|
| ArgC MSlow |
|
|---|
| LysN MSlow |
|
|---|
| TryLysC MSlow |
|
|---|
| Try MShigh |
|
|---|
| ChTry MShigh |
|
|---|
| ArgC MShigh |
|
|---|
| LysN MShigh |
|
|---|
| TryLysC MShigh |
|
|---|
General Statistics
Number of major isoforms |
Number of additional isoforms |
Number of all proteins |
Number of amino acids |
Min. Seq. Length |
Max. Seq. Length |
Avg. Seq. Length |
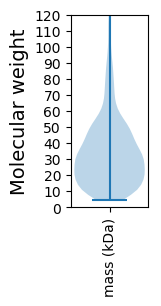
Avg. Mol. Weight |
|---|---|---|---|---|---|---|---|
0 |
835224 |
40 |
2858 |
324.6 |
35.33 |
Amino acid frequency
Ala |
Cys |
Asp |
Glu |
Phe |
Gly |
His |
Ile |
Lys |
Leu |
|---|---|---|---|---|---|---|---|---|---|
11.122 ± 0.053 | 0.96 ± 0.014 |
5.463 ± 0.035 | 5.372 ± 0.045 |
3.575 ± 0.031 | 8.367 ± 0.043 |
2.446 ± 0.02 | 5.315 ± 0.036 |
3.07 ± 0.029 | 10.385 ± 0.061 |
Met |
Asn |
Gln |
Pro |
Arg |
Ser |
Thr |
Val |
Trp |
Tyr |
|---|---|---|---|---|---|---|---|---|---|
2.562 ± 0.022 | 3.021 ± 0.038 |
5.274 ± 0.034 | 3.555 ± 0.03 |
6.804 ± 0.045 | 6.345 ± 0.037 |
5.718 ± 0.039 | 7.076 ± 0.04 |
1.333 ± 0.019 | 2.237 ± 0.03 |
Most of the basic statistics you can see at this page can be downloaded from this CSV file
See this proteome in:

Proteome-pI is available under Creative Commons Attribution-NoDerivs license, for more details see here
| Reference: Kozlowski LP. Proteome-pI 2.0: Proteome Isoelectric Point Database Update. Nucleic Acids Res. 2021, doi: 10.1093/nar/gkab944 | Contact: Lukasz P. Kozlowski |