Thermoproteus tenax virus 1 (strain KRA1) (TTV1)
Taxonomy: Viruses; Adnaviria; Zilligvirae; Taleaviricota; Tokiviricetes; Primavirales; Tristromaviridae; Betatristromavirus; Betatristromavirus TTV1; Thermoproteus tenax virus 1
Average proteome isoelectric point is 7.15
Get precalculated fractions of proteins
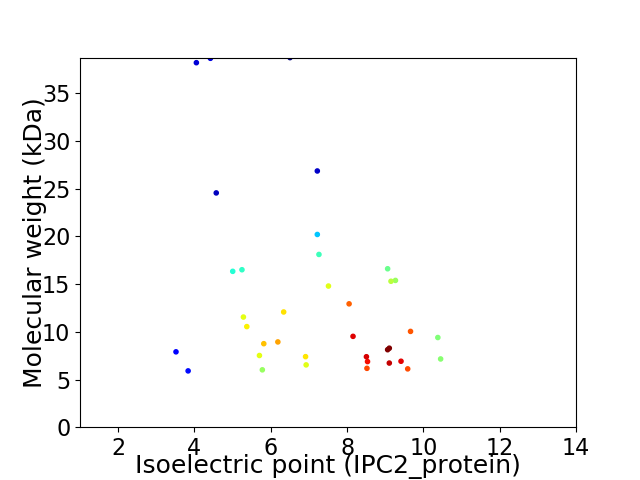
Virtual 2D-PAGE plot for 37 proteins (isoelectric point calculated using IPC2_protein)
Get csv file with sequences according to given criteria:
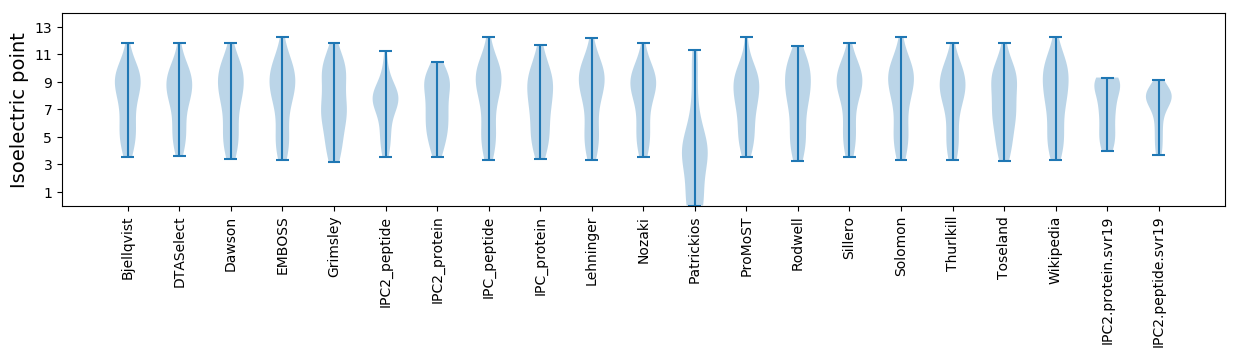
* You can choose from 21 different methods for calculating isoelectric point
Summary statistics related to proteome-wise predictions
Protein with the lowest isoelectric point:
>sp|P19307|YORW_TTV1K Uncharacterized 12.1 kDa protein OS=Thermoproteus tenax virus 1 (strain KRA1) OX=10480 PE=4 SV=1
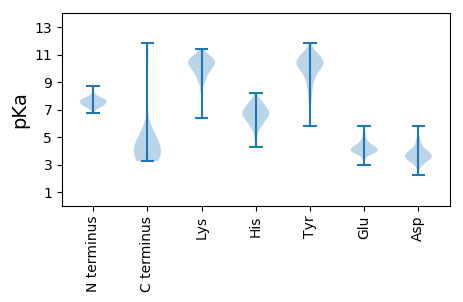
MM1 pKa = 7.73FEE3 pKa = 4.25PCLYY7 pKa = 9.82TFTFAVLPFIDD18 pKa = 4.77KK19 pKa = 10.82YY20 pKa = 9.41ITNGSVNAANCDD32 pKa = 3.05ISISFTTEE40 pKa = 3.45YY41 pKa = 10.92VPDD44 pKa = 4.3IFCSMLTFF52 pKa = 4.83
MM1 pKa = 7.73FEE3 pKa = 4.25PCLYY7 pKa = 9.82TFTFAVLPFIDD18 pKa = 4.77KK19 pKa = 10.82YY20 pKa = 9.41ITNGSVNAANCDD32 pKa = 3.05ISISFTTEE40 pKa = 3.45YY41 pKa = 10.92VPDD44 pKa = 4.3IFCSMLTFF52 pKa = 4.83
Molecular weight: 5.9 kDa
Isoelectric point according different methods:
Protein with the highest isoelectric point:
>sp|P19295|YORK_TTV1K Uncharacterized 10.5 kDa protein OS=Thermoproteus tenax virus 1 (strain KRA1) OX=10480 PE=4 SV=1
MM1 pKa = 7.93DD2 pKa = 3.35MHH4 pKa = 6.96MLRR7 pKa = 11.84LLDD10 pKa = 3.8LQCILHH16 pKa = 6.36HH17 pKa = 6.57RR18 pKa = 11.84LQEE21 pKa = 3.99RR22 pKa = 11.84MRR24 pKa = 11.84ATSVKK29 pKa = 9.8LRR31 pKa = 11.84QYY33 pKa = 10.31PQILQQHH40 pKa = 6.08RR41 pKa = 11.84CGLHH45 pKa = 5.66PRR47 pKa = 11.84SLLL50 pKa = 3.72
MM1 pKa = 7.93DD2 pKa = 3.35MHH4 pKa = 6.96MLRR7 pKa = 11.84LLDD10 pKa = 3.8LQCILHH16 pKa = 6.36HH17 pKa = 6.57RR18 pKa = 11.84LQEE21 pKa = 3.99RR22 pKa = 11.84MRR24 pKa = 11.84ATSVKK29 pKa = 9.8LRR31 pKa = 11.84QYY33 pKa = 10.31PQILQQHH40 pKa = 6.08RR41 pKa = 11.84CGLHH45 pKa = 5.66PRR47 pKa = 11.84SLLL50 pKa = 3.72
Molecular weight: 6.12 kDa
Isoelectric point according different methods:
Peptides (in silico digests for buttom-up proteomics)
Below you can find in silico digests of the whole proteome with Trypsin, Chymotrypsin, Trypsin+LysC, LysN, ArgC proteases suitable for different mass spec machines.| Try ESI |
 |
|---|
| ChTry ESI |
|
|---|
| ArgC ESI |
|
|---|
| LysN ESI |
|
|---|
| TryLysC ESI |
|
|---|
| Try MALDI |
|
|---|
| ChTry MALDI |
|
|---|
| ArgC MALDI |
|
|---|
| LysN MALDI |
|
|---|
| TryLysC MALDI |
|
|---|
| Try LTQ |
|
|---|
| ChTry LTQ |
|
|---|
| ArgC LTQ |
|
|---|
| LysN LTQ |
|
|---|
| TryLysC LTQ |
|
|---|
| Try MSlow |
|
|---|
| ChTry MSlow |
|
|---|
| ArgC MSlow |
|
|---|
| LysN MSlow |
|
|---|
| TryLysC MSlow |
|
|---|
| Try MShigh |
|
|---|
| ChTry MShigh |
|
|---|
| ArgC MShigh |
|
|---|
| LysN MShigh |
|
|---|
| TryLysC MShigh |
|
|---|
General Statistics
Number of major isoforms |
Number of additional isoforms |
Number of all proteins |
Number of amino acids |
Min. Seq. Length |
Max. Seq. Length |
Avg. Seq. Length |
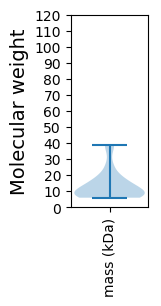
Avg. Mol. Weight |
|---|---|---|---|---|---|---|---|
0 |
4377 |
50 |
360 |
118.3 |
13.49 |
Amino acid frequency
Ala |
Cys |
Asp |
Glu |
Phe |
Gly |
His |
Ile |
Lys |
Leu |
|---|---|---|---|---|---|---|---|---|---|
5.186 ± 0.449 | 1.668 ± 0.276 |
4.432 ± 0.403 | 5.003 ± 0.694 |
4.409 ± 0.393 | 6.077 ± 0.551 |
1.645 ± 0.277 | 9.801 ± 0.562 |
4.935 ± 0.657 | 8.91 ± 0.636 |
Met |
Asn |
Gln |
Pro |
Arg |
Ser |
Thr |
Val |
Trp |
Tyr |
|---|---|---|---|---|---|---|---|---|---|
3.153 ± 0.3 | 4.775 ± 0.458 |
4.455 ± 0.613 | 2.879 ± 0.549 |
4.958 ± 0.601 | 7.608 ± 0.686 |
6.191 ± 0.763 | 6.214 ± 0.441 |
1.074 ± 0.166 | 6.626 ± 0.474 |
Most of the basic statistics you can see at this page can be downloaded from this CSV file
See this proteome in:

Proteome-pI is available under Creative Commons Attribution-NoDerivs license, for more details see here
| Reference: Kozlowski LP. Proteome-pI 2.0: Proteome Isoelectric Point Database Update. Nucleic Acids Res. 2021, doi: 10.1093/nar/gkab944 | Contact: Lukasz P. Kozlowski |