Tortoise microvirus 62
Taxonomy: Viruses; Monodnaviria; Sangervirae; Phixviricota; Malgrandaviricetes; Petitvirales; Microviridae; unclassified Microviridae
Average proteome isoelectric point is 6.12
Get precalculated fractions of proteins
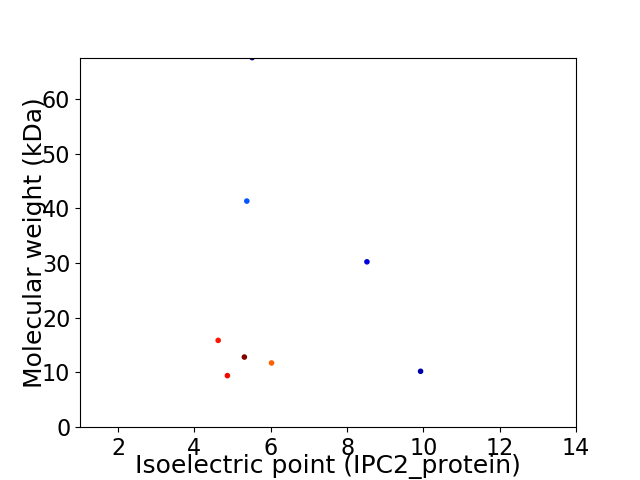
Virtual 2D-PAGE plot for 8 proteins (isoelectric point calculated using IPC2_protein)
Get csv file with sequences according to given criteria:
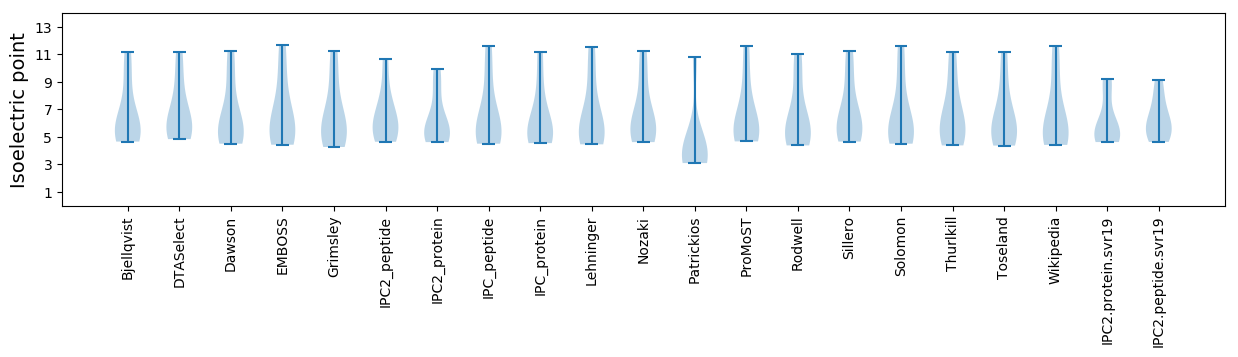
* You can choose from 21 different methods for calculating isoelectric point
Summary statistics related to proteome-wise predictions
Protein with the lowest isoelectric point:
>tr|A0A4P8W6M5|A0A4P8W6M5_9VIRU Uncharacterized protein OS=Tortoise microvirus 62 OX=2583168 PE=4 SV=1
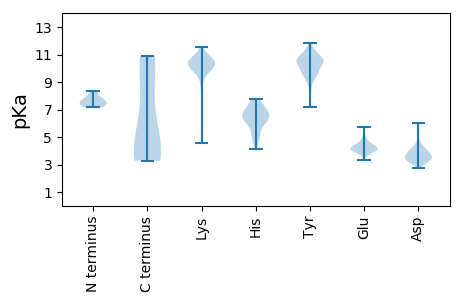
MM1 pKa = 7.54KK2 pKa = 10.36NALYY6 pKa = 10.36CLYY9 pKa = 11.25NMLSTRR15 pKa = 11.84YY16 pKa = 9.69GDD18 pKa = 3.76VVCFPTDD25 pKa = 3.06AYY27 pKa = 10.71AVQRR31 pKa = 11.84LHH33 pKa = 7.36EE34 pKa = 4.58DD35 pKa = 4.09LKK37 pKa = 11.31PEE39 pKa = 4.0ALKK42 pKa = 10.68EE43 pKa = 3.95IEE45 pKa = 4.27LCKK48 pKa = 10.1IGYY51 pKa = 9.42IDD53 pKa = 3.94ISTGIAEE60 pKa = 4.16VHH62 pKa = 5.81PPIRR66 pKa = 11.84IPLIVDD72 pKa = 3.58EE73 pKa = 4.74SVIPIDD79 pKa = 3.9NLEE82 pKa = 4.03KK83 pKa = 10.88
MM1 pKa = 7.54KK2 pKa = 10.36NALYY6 pKa = 10.36CLYY9 pKa = 11.25NMLSTRR15 pKa = 11.84YY16 pKa = 9.69GDD18 pKa = 3.76VVCFPTDD25 pKa = 3.06AYY27 pKa = 10.71AVQRR31 pKa = 11.84LHH33 pKa = 7.36EE34 pKa = 4.58DD35 pKa = 4.09LKK37 pKa = 11.31PEE39 pKa = 4.0ALKK42 pKa = 10.68EE43 pKa = 3.95IEE45 pKa = 4.27LCKK48 pKa = 10.1IGYY51 pKa = 9.42IDD53 pKa = 3.94ISTGIAEE60 pKa = 4.16VHH62 pKa = 5.81PPIRR66 pKa = 11.84IPLIVDD72 pKa = 3.58EE73 pKa = 4.74SVIPIDD79 pKa = 3.9NLEE82 pKa = 4.03KK83 pKa = 10.88
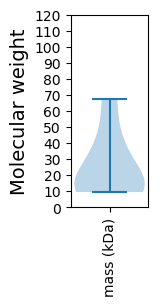
Molecular weight: 9.42 kDa
Isoelectric point according different methods:
Protein with the highest isoelectric point:
>tr|A0A4V1FVZ9|A0A4V1FVZ9_9VIRU Uncharacterized protein OS=Tortoise microvirus 62 OX=2583168 PE=4 SV=1
MM1 pKa = 7.85RR2 pKa = 11.84FTMRR6 pKa = 11.84SIAPSTRR13 pKa = 11.84LVGAFRR19 pKa = 11.84DD20 pKa = 3.99TCSMLVGSWDD30 pKa = 3.82CLHH33 pKa = 6.35FTAKK37 pKa = 10.03ALSRR41 pKa = 11.84ILFVPRR47 pKa = 11.84SWRR50 pKa = 11.84CLMLTLQTVLFFQVAMLVVLISPFYY75 pKa = 9.96FLKK78 pKa = 10.45RR79 pKa = 11.84LCRR82 pKa = 11.84RR83 pKa = 11.84LTIYY87 pKa = 10.86
MM1 pKa = 7.85RR2 pKa = 11.84FTMRR6 pKa = 11.84SIAPSTRR13 pKa = 11.84LVGAFRR19 pKa = 11.84DD20 pKa = 3.99TCSMLVGSWDD30 pKa = 3.82CLHH33 pKa = 6.35FTAKK37 pKa = 10.03ALSRR41 pKa = 11.84ILFVPRR47 pKa = 11.84SWRR50 pKa = 11.84CLMLTLQTVLFFQVAMLVVLISPFYY75 pKa = 9.96FLKK78 pKa = 10.45RR79 pKa = 11.84LCRR82 pKa = 11.84RR83 pKa = 11.84LTIYY87 pKa = 10.86
Molecular weight: 10.21 kDa
Isoelectric point according different methods:
Peptides (in silico digests for buttom-up proteomics)
Below you can find in silico digests of the whole proteome with Trypsin, Chymotrypsin, Trypsin+LysC, LysN, ArgC proteases suitable for different mass spec machines.| Try ESI |
 |
|---|
| ChTry ESI |
|
|---|
| ArgC ESI |
|
|---|
| LysN ESI |
|
|---|
| TryLysC ESI |
|
|---|
| Try MALDI |
|
|---|
| ChTry MALDI |
|
|---|
| ArgC MALDI |
|
|---|
| LysN MALDI |
|
|---|
| TryLysC MALDI |
|
|---|
| Try LTQ |
|
|---|
| ChTry LTQ |
|
|---|
| ArgC LTQ |
|
|---|
| LysN LTQ |
|
|---|
| TryLysC LTQ |
|
|---|
| Try MSlow |
|
|---|
| ChTry MSlow |
|
|---|
| ArgC MSlow |
|
|---|
| LysN MSlow |
|
|---|
| TryLysC MSlow |
|
|---|
| Try MShigh |
|
|---|
| ChTry MShigh |
|
|---|
| ArgC MShigh |
|
|---|
| LysN MShigh |
|
|---|
| TryLysC MShigh |
|
|---|
General Statistics
Number of major isoforms |
Number of additional isoforms |
Number of all proteins |
Number of amino acids |
Min. Seq. Length |
Max. Seq. Length |
Avg. Seq. Length |
Avg. Mol. Weight |
|---|---|---|---|---|---|---|---|
0 |
1761 |
83 |
604 |
220.1 |
24.89 |
Amino acid frequency
Ala |
Cys |
Asp |
Glu |
Phe |
Gly |
His |
Ile |
Lys |
Leu |
|---|---|---|---|---|---|---|---|---|---|
7.666 ± 0.885 | 1.533 ± 0.543 |
6.133 ± 0.776 | 4.884 ± 1.089 |
5.508 ± 0.709 | 5.224 ± 0.497 |
1.931 ± 0.424 | 4.827 ± 0.872 |
4.202 ± 0.872 | 9.143 ± 0.789 |
Met |
Asn |
Gln |
Pro |
Arg |
Ser |
Thr |
Val |
Trp |
Tyr |
|---|---|---|---|---|---|---|---|---|---|
2.896 ± 0.51 | 4.429 ± 0.685 |
4.656 ± 0.591 | 3.805 ± 1.406 |
6.019 ± 0.68 | 10.392 ± 1.108 |
5.508 ± 0.6 | 4.997 ± 0.555 |
1.022 ± 0.186 | 5.224 ± 0.515 |
Most of the basic statistics you can see at this page can be downloaded from this CSV file
See this proteome in:

Proteome-pI is available under Creative Commons Attribution-NoDerivs license, for more details see here
| Reference: Kozlowski LP. Proteome-pI 2.0: Proteome Isoelectric Point Database Update. Nucleic Acids Res. 2021, doi: 10.1093/nar/gkab944 | Contact: Lukasz P. Kozlowski |