Salmo salar (Atlantic salmon)
Taxonomy: cellular organisms; Eukaryota; Opisthokonta; Metazoa; Eumetazoa; Bilateria; Deuterostomia; Chordata; Craniata; Vertebrata; Gnathostomata; Teleostomi; Euteleostomi; Actinopterygii; Actinopteri; Neopterygii; Teleostei; Osteoglossocephalai; Clupeocephala; Euteleosteomorpha; Protacanthopterygii; Salmoniformes; Salmonidae; Salmoninae;
Average proteome isoelectric point is 6.46
Get precalculated fractions of proteins
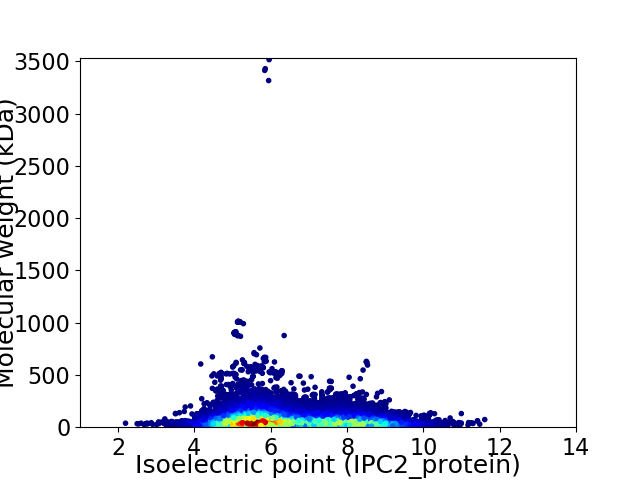
Virtual 2D-PAGE plot for 82392 proteins (isoelectric point calculated using IPC2_protein)
Get csv file with sequences according to given criteria:
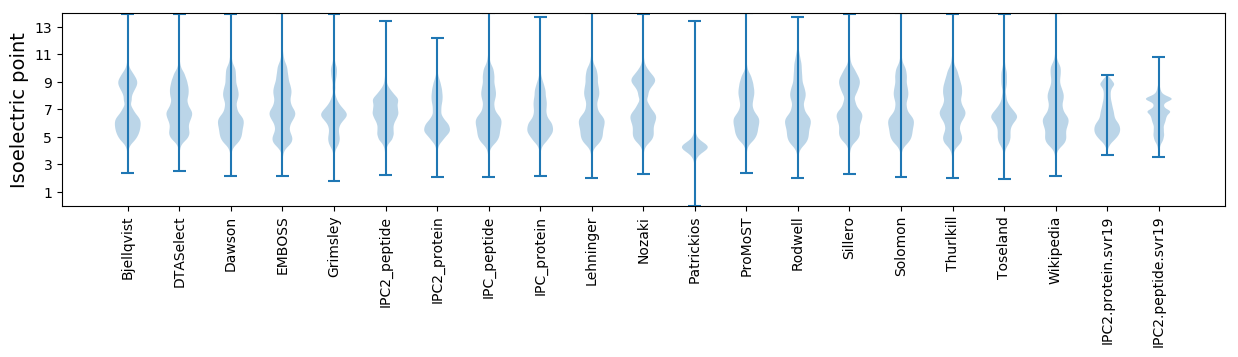
* You can choose from 21 different methods for calculating isoelectric point
Summary statistics related to proteome-wise predictions
Protein with the lowest isoelectric point:
>tr|A0A1S3R2G4|A0A1S3R2G4_SALSA dual specificity testis-specific protein kinase 2-like OS=Salmo salar OX=8030 GN=LOC106599373 PE=4 SV=1
MM1 pKa = 7.69LLAQINRR8 pKa = 11.84DD9 pKa = 3.41SQGIAEE15 pKa = 4.33FQNAGGDD22 pKa = 3.94SQQVTLCLAEE32 pKa = 4.3AVSDD36 pKa = 3.91GDD38 pKa = 3.92QMDD41 pKa = 4.02MDD43 pKa = 4.6TVSLQAVTLADD54 pKa = 3.56GSTAYY59 pKa = 9.46IQHH62 pKa = 6.13NPKK65 pKa = 10.24DD66 pKa = 4.06GKK68 pKa = 11.24FMDD71 pKa = 4.28GQVIQLEE78 pKa = 4.65DD79 pKa = 3.43GSTAYY84 pKa = 9.69VQHH87 pKa = 7.41VSMPRR92 pKa = 11.84AEE94 pKa = 4.32EE95 pKa = 3.89ANRR98 pKa = 11.84WTGSPLCDD106 pKa = 3.76VIGGDD111 pKa = 4.44GLRR114 pKa = 11.84LEE116 pKa = 5.6DD117 pKa = 3.91GQAVQLEE124 pKa = 4.74DD125 pKa = 3.15GTTAYY130 pKa = 9.77IHH132 pKa = 5.91TPKK135 pKa = 9.87DD136 pKa = 3.23TYY138 pKa = 11.28DD139 pKa = 3.45QNTLQAVQLEE149 pKa = 4.79DD150 pKa = 3.18GTTAYY155 pKa = 9.44IQHH158 pKa = 6.15TVQMPQTNTILAIQADD174 pKa = 4.42GTVSDD179 pKa = 5.05LNADD183 pKa = 3.55GTLDD187 pKa = 3.46QEE189 pKa = 4.81TINVLEE195 pKa = 4.12QYY197 pKa = 7.13TAKK200 pKa = 10.14VVCYY204 pKa = 10.39
MM1 pKa = 7.69LLAQINRR8 pKa = 11.84DD9 pKa = 3.41SQGIAEE15 pKa = 4.33FQNAGGDD22 pKa = 3.94SQQVTLCLAEE32 pKa = 4.3AVSDD36 pKa = 3.91GDD38 pKa = 3.92QMDD41 pKa = 4.02MDD43 pKa = 4.6TVSLQAVTLADD54 pKa = 3.56GSTAYY59 pKa = 9.46IQHH62 pKa = 6.13NPKK65 pKa = 10.24DD66 pKa = 4.06GKK68 pKa = 11.24FMDD71 pKa = 4.28GQVIQLEE78 pKa = 4.65DD79 pKa = 3.43GSTAYY84 pKa = 9.69VQHH87 pKa = 7.41VSMPRR92 pKa = 11.84AEE94 pKa = 4.32EE95 pKa = 3.89ANRR98 pKa = 11.84WTGSPLCDD106 pKa = 3.76VIGGDD111 pKa = 4.44GLRR114 pKa = 11.84LEE116 pKa = 5.6DD117 pKa = 3.91GQAVQLEE124 pKa = 4.74DD125 pKa = 3.15GTTAYY130 pKa = 9.77IHH132 pKa = 5.91TPKK135 pKa = 9.87DD136 pKa = 3.23TYY138 pKa = 11.28DD139 pKa = 3.45QNTLQAVQLEE149 pKa = 4.79DD150 pKa = 3.18GTTAYY155 pKa = 9.44IQHH158 pKa = 6.15TVQMPQTNTILAIQADD174 pKa = 4.42GTVSDD179 pKa = 5.05LNADD183 pKa = 3.55GTLDD187 pKa = 3.46QEE189 pKa = 4.81TINVLEE195 pKa = 4.12QYY197 pKa = 7.13TAKK200 pKa = 10.14VVCYY204 pKa = 10.39
Molecular weight: 22.02 kDa
Isoelectric point according different methods:
Protein with the highest isoelectric point:
>tr|A0A1S3MIX3|A0A1S3MIX3_SALSA RNA-binding protein 10-like OS=Salmo salar OX=8030 GN=LOC106572966 PE=4 SV=1
MM1 pKa = 7.41FLLRR5 pKa = 11.84HH6 pKa = 5.69QLTTHH11 pKa = 5.94TPIHH15 pKa = 5.95RR16 pKa = 11.84HH17 pKa = 4.92QLTTHH22 pKa = 5.9TPIHH26 pKa = 6.08RR27 pKa = 11.84HH28 pKa = 4.92QLTISHH34 pKa = 6.18TPIHH38 pKa = 6.21RR39 pKa = 11.84HH40 pKa = 4.95QLTISHH46 pKa = 6.04TLIHH50 pKa = 6.38RR51 pKa = 11.84HH52 pKa = 5.42QLTTHH57 pKa = 5.9TPIHH61 pKa = 5.95RR62 pKa = 11.84HH63 pKa = 4.92QLTTHH68 pKa = 5.9TPIHH72 pKa = 6.08RR73 pKa = 11.84HH74 pKa = 4.92QLTISHH80 pKa = 6.04TLIHH84 pKa = 6.46RR85 pKa = 11.84HH86 pKa = 5.33QLTISHH92 pKa = 6.04TLIHH96 pKa = 6.46RR97 pKa = 11.84HH98 pKa = 5.32QLTISHH104 pKa = 6.8ILIFRR109 pKa = 11.84HH110 pKa = 5.49QLTISHH116 pKa = 6.04TLIHH120 pKa = 6.38RR121 pKa = 11.84HH122 pKa = 5.42QLTTHH127 pKa = 5.9TPIHH131 pKa = 5.95RR132 pKa = 11.84HH133 pKa = 4.92QLTTHH138 pKa = 5.9TPIHH142 pKa = 6.08RR143 pKa = 11.84HH144 pKa = 4.87QLTITHH150 pKa = 6.75SNTQASTNHH159 pKa = 5.29FTHH162 pKa = 6.94SNTQASTNHH171 pKa = 5.29FTHH174 pKa = 6.94SNTQASTNHH183 pKa = 5.29FTHH186 pKa = 6.94SNTQASTNHH195 pKa = 5.29FTHH198 pKa = 6.97SNTQTSTNHH207 pKa = 5.54LTHH210 pKa = 7.2SITQASTNHH219 pKa = 5.0THH221 pKa = 7.35SNTQTSTNHH230 pKa = 4.57THH232 pKa = 7.03SNTQASTNHH241 pKa = 5.29FTHH244 pKa = 6.94SNTQASTNHH253 pKa = 5.29FTHH256 pKa = 6.94SNTQASTNHH265 pKa = 5.28FTHH268 pKa = 7.2SITQASTNHH277 pKa = 5.26FTHH280 pKa = 6.94SNTQASTKK288 pKa = 10.36HH289 pKa = 4.83FTHH292 pKa = 6.94SNTQASTNHH301 pKa = 5.29FTHH304 pKa = 7.11SNTQTT309 pKa = 3.08
MM1 pKa = 7.41FLLRR5 pKa = 11.84HH6 pKa = 5.69QLTTHH11 pKa = 5.94TPIHH15 pKa = 5.95RR16 pKa = 11.84HH17 pKa = 4.92QLTTHH22 pKa = 5.9TPIHH26 pKa = 6.08RR27 pKa = 11.84HH28 pKa = 4.92QLTISHH34 pKa = 6.18TPIHH38 pKa = 6.21RR39 pKa = 11.84HH40 pKa = 4.95QLTISHH46 pKa = 6.04TLIHH50 pKa = 6.38RR51 pKa = 11.84HH52 pKa = 5.42QLTTHH57 pKa = 5.9TPIHH61 pKa = 5.95RR62 pKa = 11.84HH63 pKa = 4.92QLTTHH68 pKa = 5.9TPIHH72 pKa = 6.08RR73 pKa = 11.84HH74 pKa = 4.92QLTISHH80 pKa = 6.04TLIHH84 pKa = 6.46RR85 pKa = 11.84HH86 pKa = 5.33QLTISHH92 pKa = 6.04TLIHH96 pKa = 6.46RR97 pKa = 11.84HH98 pKa = 5.32QLTISHH104 pKa = 6.8ILIFRR109 pKa = 11.84HH110 pKa = 5.49QLTISHH116 pKa = 6.04TLIHH120 pKa = 6.38RR121 pKa = 11.84HH122 pKa = 5.42QLTTHH127 pKa = 5.9TPIHH131 pKa = 5.95RR132 pKa = 11.84HH133 pKa = 4.92QLTTHH138 pKa = 5.9TPIHH142 pKa = 6.08RR143 pKa = 11.84HH144 pKa = 4.87QLTITHH150 pKa = 6.75SNTQASTNHH159 pKa = 5.29FTHH162 pKa = 6.94SNTQASTNHH171 pKa = 5.29FTHH174 pKa = 6.94SNTQASTNHH183 pKa = 5.29FTHH186 pKa = 6.94SNTQASTNHH195 pKa = 5.29FTHH198 pKa = 6.97SNTQTSTNHH207 pKa = 5.54LTHH210 pKa = 7.2SITQASTNHH219 pKa = 5.0THH221 pKa = 7.35SNTQTSTNHH230 pKa = 4.57THH232 pKa = 7.03SNTQASTNHH241 pKa = 5.29FTHH244 pKa = 6.94SNTQASTNHH253 pKa = 5.29FTHH256 pKa = 6.94SNTQASTNHH265 pKa = 5.28FTHH268 pKa = 7.2SITQASTNHH277 pKa = 5.26FTHH280 pKa = 6.94SNTQASTKK288 pKa = 10.36HH289 pKa = 4.83FTHH292 pKa = 6.94SNTQASTNHH301 pKa = 5.29FTHH304 pKa = 7.11SNTQTT309 pKa = 3.08
Molecular weight: 35.59 kDa
Isoelectric point according different methods:
Peptides (in silico digests for buttom-up proteomics)
Below you can find in silico digests of the whole proteome with Trypsin, Chymotrypsin, Trypsin+LysC, LysN, ArgC proteases suitable for different mass spec machines.| Try ESI |
 |
|---|
| ChTry ESI |
|
|---|
| ArgC ESI |
|
|---|
| LysN ESI |
|
|---|
| TryLysC ESI |
|
|---|
| Try MALDI |
|
|---|
| ChTry MALDI |
|
|---|
| ArgC MALDI |
|
|---|
| LysN MALDI |
|
|---|
| TryLysC MALDI |
|
|---|
| Try LTQ |
|
|---|
| ChTry LTQ |
|
|---|
| ArgC LTQ |
|
|---|
| LysN LTQ |
|
|---|
| TryLysC LTQ |
|
|---|
| Try MSlow |
|
|---|
| ChTry MSlow |
|
|---|
| ArgC MSlow |
|
|---|
| LysN MSlow |
|
|---|
| TryLysC MSlow |
|
|---|
| Try MShigh |
|
|---|
| ChTry MShigh |
|
|---|
| ArgC MShigh |
|
|---|
| LysN MShigh |
|
|---|
| TryLysC MShigh |
|
|---|
General Statistics
Number of major isoforms |
Number of additional isoforms |
Number of all proteins |
Number of amino acids |
Min. Seq. Length |
Max. Seq. Length |
Avg. Seq. Length |
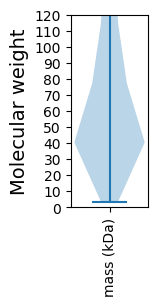
Avg. Mol. Weight |
|---|---|---|---|---|---|---|---|
58348648 |
31 |
32943 |
708.2 |
78.71 |
Amino acid frequency
Ala |
Cys |
Asp |
Glu |
Phe |
Gly |
His |
Ile |
Lys |
Leu |
|---|---|---|---|---|---|---|---|---|---|
6.422 ± 0.008 | 2.055 ± 0.007 |
5.215 ± 0.006 | 7.144 ± 0.015 |
3.16 ± 0.006 | 6.76 ± 0.014 |
2.711 ± 0.006 | 4.077 ± 0.009 |
5.541 ± 0.013 | 9.125 ± 0.013 |
Met |
Asn |
Gln |
Pro |
Arg |
Ser |
Thr |
Val |
Trp |
Tyr |
|---|---|---|---|---|---|---|---|---|---|
2.458 ± 0.005 | 3.722 ± 0.005 |
6.241 ± 0.014 | 5.009 ± 0.012 |
5.722 ± 0.007 | 8.847 ± 0.012 |
5.928 ± 0.01 | 6.215 ± 0.009 |
1.057 ± 0.003 | 2.591 ± 0.005 |
Most of the basic statistics you can see at this page can be downloaded from this CSV file
See this proteome in:

Proteome-pI is available under Creative Commons Attribution-NoDerivs license, for more details see here
| Reference: Kozlowski LP. Proteome-pI 2.0: Proteome Isoelectric Point Database Update. Nucleic Acids Res. 2021, doi: 10.1093/nar/gkab944 | Contact: Lukasz P. Kozlowski |