Magnetospirillum sp. SS-4
Taxonomy: cellular organisms; Bacteria; Proteobacteria; Alphaproteobacteria; Rhodospirillales; Rhodospirillaceae; Magnetospirillum; unclassified Magnetospirillum
Average proteome isoelectric point is 6.7
Get precalculated fractions of proteins
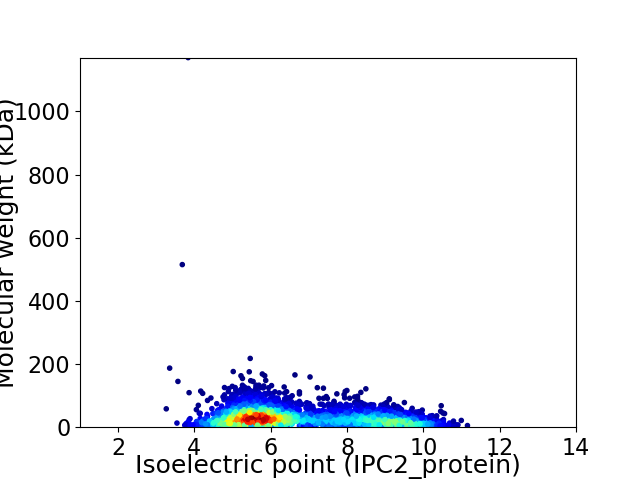
Virtual 2D-PAGE plot for 4587 proteins (isoelectric point calculated using IPC2_protein)
Get csv file with sequences according to given criteria:
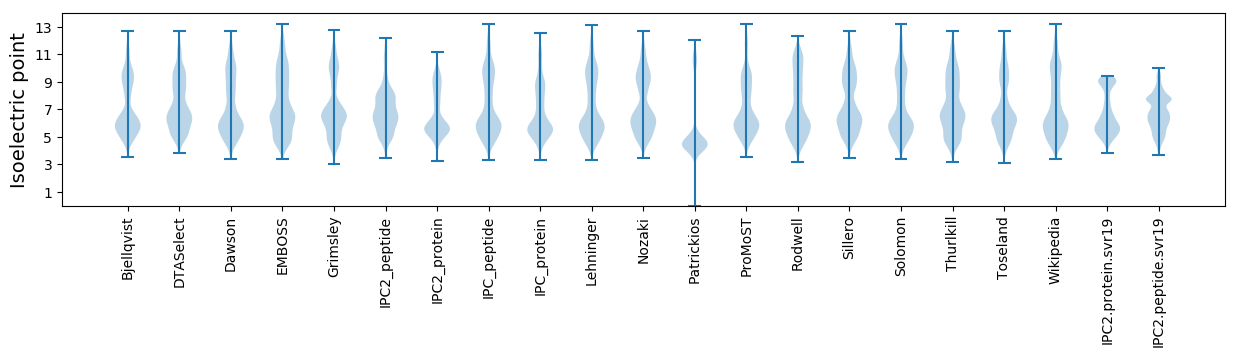
* You can choose from 21 different methods for calculating isoelectric point
Summary statistics related to proteome-wise predictions
Protein with the lowest isoelectric point:
>tr|A0A6J4FYC0|A0A6J4FYC0_9PROT Uncharacterized protein OS=Magnetospirillum sp. SS-4 OX=2681465 GN=MTBSS4_460011 PE=3 SV=1
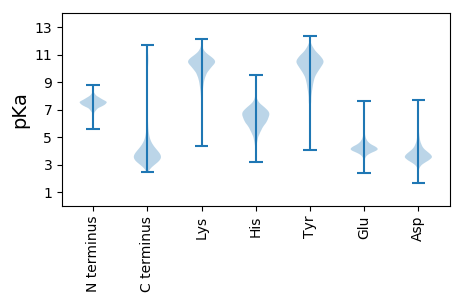
MM1 pKa = 7.5KK2 pKa = 10.22KK3 pKa = 10.07YY4 pKa = 10.92VCVVCNFVYY13 pKa = 10.57DD14 pKa = 4.08PAIGMPDD21 pKa = 3.47DD22 pKa = 5.66GIPAGTPFEE31 pKa = 5.25NIPDD35 pKa = 3.68DD36 pKa = 3.92WTCPEE41 pKa = 4.54CGVSKK46 pKa = 11.0SDD48 pKa = 4.46FEE50 pKa = 4.47VQEE53 pKa = 4.29GG54 pKa = 3.47
MM1 pKa = 7.5KK2 pKa = 10.22KK3 pKa = 10.07YY4 pKa = 10.92VCVVCNFVYY13 pKa = 10.57DD14 pKa = 4.08PAIGMPDD21 pKa = 3.47DD22 pKa = 5.66GIPAGTPFEE31 pKa = 5.25NIPDD35 pKa = 3.68DD36 pKa = 3.92WTCPEE41 pKa = 4.54CGVSKK46 pKa = 11.0SDD48 pKa = 4.46FEE50 pKa = 4.47VQEE53 pKa = 4.29GG54 pKa = 3.47
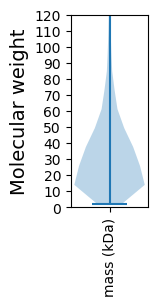
Molecular weight: 5.92 kDa
Isoelectric point according different methods:
Protein with the highest isoelectric point:
>tr|A0A6J4F4X8|A0A6J4F4X8_9PROT Riboflavin biosynthesis protein OS=Magnetospirillum sp. SS-4 OX=2681465 GN=ribF PE=3 SV=1
MM1 pKa = 7.35KK2 pKa = 9.43RR3 pKa = 11.84TYY5 pKa = 10.27QPSKK9 pKa = 9.43LVRR12 pKa = 11.84ARR14 pKa = 11.84RR15 pKa = 11.84HH16 pKa = 4.38GFRR19 pKa = 11.84ARR21 pKa = 11.84MATVGGRR28 pKa = 11.84RR29 pKa = 11.84VINNRR34 pKa = 11.84RR35 pKa = 11.84RR36 pKa = 11.84QGRR39 pKa = 11.84KK40 pKa = 9.21KK41 pKa = 10.63LSAA44 pKa = 3.91
MM1 pKa = 7.35KK2 pKa = 9.43RR3 pKa = 11.84TYY5 pKa = 10.27QPSKK9 pKa = 9.43LVRR12 pKa = 11.84ARR14 pKa = 11.84RR15 pKa = 11.84HH16 pKa = 4.38GFRR19 pKa = 11.84ARR21 pKa = 11.84MATVGGRR28 pKa = 11.84RR29 pKa = 11.84VINNRR34 pKa = 11.84RR35 pKa = 11.84RR36 pKa = 11.84QGRR39 pKa = 11.84KK40 pKa = 9.21KK41 pKa = 10.63LSAA44 pKa = 3.91
Molecular weight: 5.22 kDa
Isoelectric point according different methods:
Peptides (in silico digests for buttom-up proteomics)
Below you can find in silico digests of the whole proteome with Trypsin, Chymotrypsin, Trypsin+LysC, LysN, ArgC proteases suitable for different mass spec machines.| Try ESI |
 |
|---|
| ChTry ESI |
|
|---|
| ArgC ESI |
|
|---|
| LysN ESI |
|
|---|
| TryLysC ESI |
|
|---|
| Try MALDI |
|
|---|
| ChTry MALDI |
|
|---|
| ArgC MALDI |
|
|---|
| LysN MALDI |
|
|---|
| TryLysC MALDI |
|
|---|
| Try LTQ |
|
|---|
| ChTry LTQ |
|
|---|
| ArgC LTQ |
|
|---|
| LysN LTQ |
|
|---|
| TryLysC LTQ |
|
|---|
| Try MSlow |
|
|---|
| ChTry MSlow |
|
|---|
| ArgC MSlow |
|
|---|
| LysN MSlow |
|
|---|
| TryLysC MSlow |
|
|---|
| Try MShigh |
|
|---|
| ChTry MShigh |
|
|---|
| ArgC MShigh |
|
|---|
| LysN MShigh |
|
|---|
| TryLysC MShigh |
|
|---|
General Statistics
Number of major isoforms |
Number of additional isoforms |
Number of all proteins |
Number of amino acids |
Min. Seq. Length |
Max. Seq. Length |
Avg. Seq. Length |
Avg. Mol. Weight |
|---|---|---|---|---|---|---|---|
0 |
1402263 |
20 |
11740 |
305.7 |
33.14 |
Amino acid frequency
Ala |
Cys |
Asp |
Glu |
Phe |
Gly |
His |
Ile |
Lys |
Leu |
|---|---|---|---|---|---|---|---|---|---|
12.678 ± 0.072 | 1.026 ± 0.018 |
5.996 ± 0.032 | 5.626 ± 0.041 |
3.419 ± 0.024 | 8.75 ± 0.051 |
2.243 ± 0.022 | 4.825 ± 0.027 |
3.158 ± 0.038 | 10.256 ± 0.058 |
Met |
Asn |
Gln |
Pro |
Arg |
Ser |
Thr |
Val |
Trp |
Tyr |
|---|---|---|---|---|---|---|---|---|---|
2.619 ± 0.023 | 2.392 ± 0.029 |
5.295 ± 0.041 | 2.876 ± 0.021 |
7.732 ± 0.077 | 5.227 ± 0.043 |
5.01 ± 0.067 | 7.547 ± 0.031 |
1.351 ± 0.016 | 1.973 ± 0.021 |
Most of the basic statistics you can see at this page can be downloaded from this CSV file
See this proteome in:

Proteome-pI is available under Creative Commons Attribution-NoDerivs license, for more details see here
| Reference: Kozlowski LP. Proteome-pI 2.0: Proteome Isoelectric Point Database Update. Nucleic Acids Res. 2021, doi: 10.1093/nar/gkab944 | Contact: Lukasz P. Kozlowski |