Pseudarcicella hirudinis
Taxonomy: cellular organisms; Bacteria; FCB group; Bacteroidetes/Chlorobi group; Bacteroidetes; Cytophagia; Cytophagales; Cytophagaceae; Pseudarcicella
Average proteome isoelectric point is 6.78
Get precalculated fractions of proteins
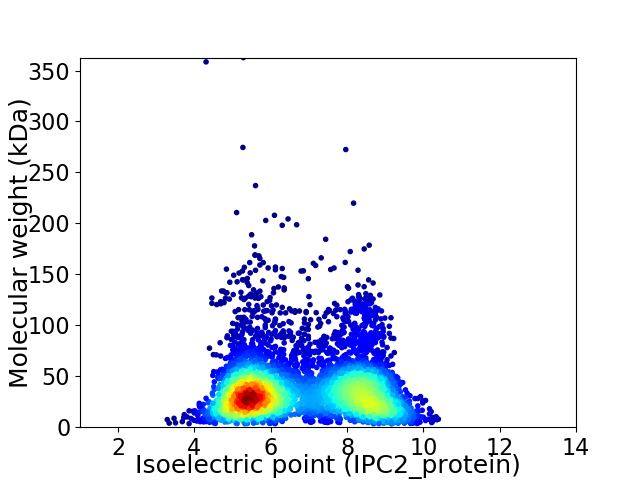
Virtual 2D-PAGE plot for 4993 proteins (isoelectric point calculated using IPC2_protein)
Get csv file with sequences according to given criteria:
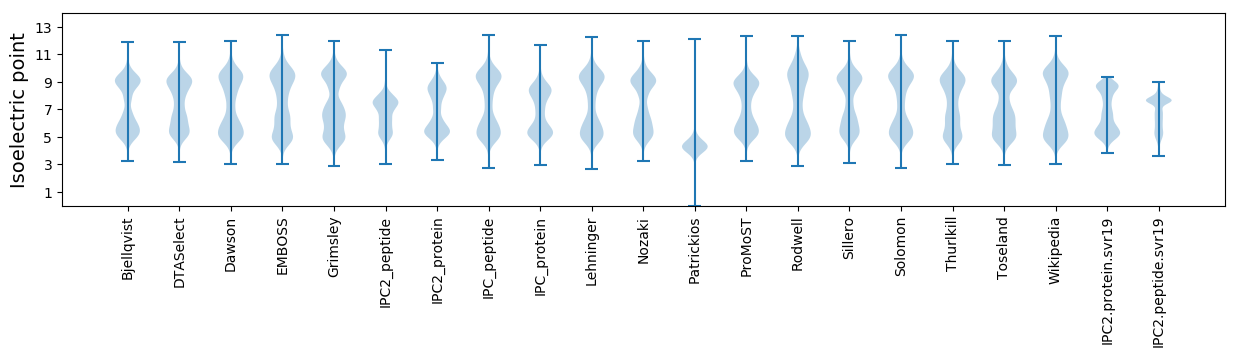
* You can choose from 21 different methods for calculating isoelectric point
Summary statistics related to proteome-wise predictions
Protein with the lowest isoelectric point:
>tr|A0A1I5X0X9|A0A1I5X0X9_9BACT 30S ribosomal protein S6 OS=Pseudarcicella hirudinis OX=1079859 GN=rpsF PE=3 SV=1
MM1 pKa = 7.31FLQWLIFLPLILPLSIISGAIQGIKK26 pKa = 9.67SAVYY30 pKa = 10.46DD31 pKa = 5.09LINQIQVDD39 pKa = 4.02VSSQIIHH46 pKa = 7.07EE47 pKa = 4.83DD48 pKa = 3.5SQDD51 pKa = 3.26SYY53 pKa = 12.13LL54 pKa = 4.03
MM1 pKa = 7.31FLQWLIFLPLILPLSIISGAIQGIKK26 pKa = 9.67SAVYY30 pKa = 10.46DD31 pKa = 5.09LINQIQVDD39 pKa = 4.02VSSQIIHH46 pKa = 7.07EE47 pKa = 4.83DD48 pKa = 3.5SQDD51 pKa = 3.26SYY53 pKa = 12.13LL54 pKa = 4.03
Molecular weight: 6.09 kDa
Isoelectric point according different methods:
Protein with the highest isoelectric point:
>tr|A0A1I5WQI8|A0A1I5WQI8_9BACT Peroxiredoxin OS=Pseudarcicella hirudinis OX=1079859 GN=SAMN04515674_112113 PE=4 SV=1
MM1 pKa = 8.02VLILLLLISNTASFAQCAMCRR22 pKa = 11.84ATVEE26 pKa = 4.35STMSNGRR33 pKa = 11.84NLAATGLNTGILYY46 pKa = 10.48LLSAPYY52 pKa = 10.39LIVAGVAFLWYY63 pKa = 9.78RR64 pKa = 11.84NSKK67 pKa = 10.61KK68 pKa = 9.23EE69 pKa = 3.86VKK71 pKa = 10.04RR72 pKa = 11.84RR73 pKa = 11.84EE74 pKa = 4.03NMNLVQRR81 pKa = 11.84RR82 pKa = 11.84LNQVLGRR89 pKa = 11.84II90 pKa = 4.2
MM1 pKa = 8.02VLILLLLISNTASFAQCAMCRR22 pKa = 11.84ATVEE26 pKa = 4.35STMSNGRR33 pKa = 11.84NLAATGLNTGILYY46 pKa = 10.48LLSAPYY52 pKa = 10.39LIVAGVAFLWYY63 pKa = 9.78RR64 pKa = 11.84NSKK67 pKa = 10.61KK68 pKa = 9.23EE69 pKa = 3.86VKK71 pKa = 10.04RR72 pKa = 11.84RR73 pKa = 11.84EE74 pKa = 4.03NMNLVQRR81 pKa = 11.84RR82 pKa = 11.84LNQVLGRR89 pKa = 11.84II90 pKa = 4.2
Molecular weight: 10.04 kDa
Isoelectric point according different methods:
Peptides (in silico digests for buttom-up proteomics)
Below you can find in silico digests of the whole proteome with Trypsin, Chymotrypsin, Trypsin+LysC, LysN, ArgC proteases suitable for different mass spec machines.| Try ESI |
 |
|---|
| ChTry ESI |
|
|---|
| ArgC ESI |
|
|---|
| LysN ESI |
|
|---|
| TryLysC ESI |
|
|---|
| Try MALDI |
|
|---|
| ChTry MALDI |
|
|---|
| ArgC MALDI |
|
|---|
| LysN MALDI |
|
|---|
| TryLysC MALDI |
|
|---|
| Try LTQ |
|
|---|
| ChTry LTQ |
|
|---|
| ArgC LTQ |
|
|---|
| LysN LTQ |
|
|---|
| TryLysC LTQ |
|
|---|
| Try MSlow |
|
|---|
| ChTry MSlow |
|
|---|
| ArgC MSlow |
|
|---|
| LysN MSlow |
|
|---|
| TryLysC MSlow |
|
|---|
| Try MShigh |
|
|---|
| ChTry MShigh |
|
|---|
| ArgC MShigh |
|
|---|
| LysN MShigh |
|
|---|
| TryLysC MShigh |
|
|---|
General Statistics
Number of major isoforms |
Number of additional isoforms |
Number of all proteins |
Number of amino acids |
Min. Seq. Length |
Max. Seq. Length |
Avg. Seq. Length |
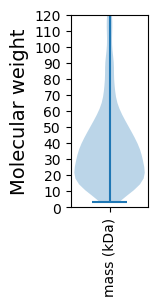
Avg. Mol. Weight |
|---|---|---|---|---|---|---|---|
0 |
1789070 |
29 |
3529 |
358.3 |
40.26 |
Amino acid frequency
Ala |
Cys |
Asp |
Glu |
Phe |
Gly |
His |
Ile |
Lys |
Leu |
|---|---|---|---|---|---|---|---|---|---|
6.763 ± 0.033 | 0.84 ± 0.014 |
5.146 ± 0.024 | 6.135 ± 0.043 |
5.237 ± 0.029 | 6.915 ± 0.034 |
1.683 ± 0.019 | 7.325 ± 0.029 |
7.348 ± 0.035 | 9.439 ± 0.041 |
Met |
Asn |
Gln |
Pro |
Arg |
Ser |
Thr |
Val |
Trp |
Tyr |
|---|---|---|---|---|---|---|---|---|---|
2.161 ± 0.019 | 5.795 ± 0.039 |
3.789 ± 0.018 | 3.666 ± 0.021 |
3.817 ± 0.021 | 6.862 ± 0.035 |
5.657 ± 0.043 | 6.195 ± 0.029 |
1.243 ± 0.014 | 3.985 ± 0.022 |
Most of the basic statistics you can see at this page can be downloaded from this CSV file
See this proteome in:

Proteome-pI is available under Creative Commons Attribution-NoDerivs license, for more details see here
| Reference: Kozlowski LP. Proteome-pI 2.0: Proteome Isoelectric Point Database Update. Nucleic Acids Res. 2021, doi: 10.1093/nar/gkab944 | Contact: Lukasz P. Kozlowski |