Callipepla squamata (Scaled quail)
Taxonomy: cellular organisms; Eukaryota; Opisthokonta; Metazoa; Eumetazoa; Bilateria; Deuterostomia; Chordata; Craniata; Vertebrata; Gnathostomata; Teleostomi; Euteleostomi; Sarcopterygii; Dipnotetrapodomorpha; Tetrapoda; Amniota; Sauropsida; Sauria; Archelosauria; Archosauria; Dinosauria;
Average proteome isoelectric point is 6.54
Get precalculated fractions of proteins
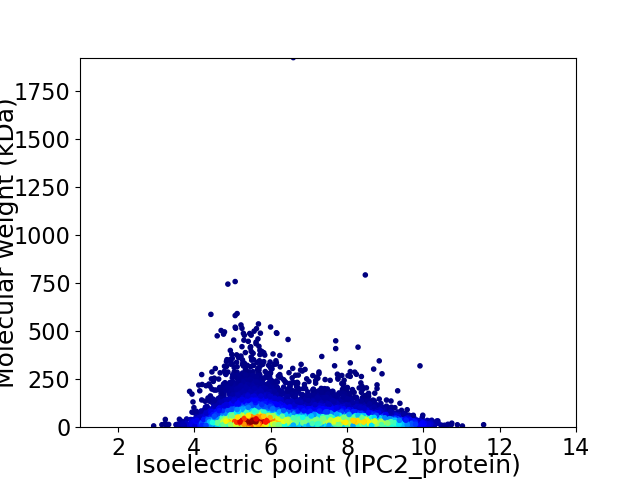
Virtual 2D-PAGE plot for 16973 proteins (isoelectric point calculated using IPC2_protein)
Get csv file with sequences according to given criteria:
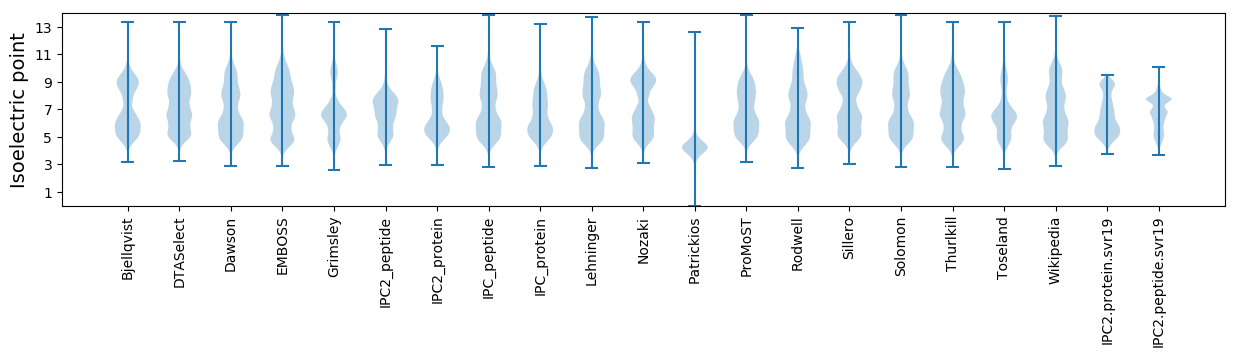
* You can choose from 21 different methods for calculating isoelectric point
Summary statistics related to proteome-wise predictions
Protein with the lowest isoelectric point:
>tr|A0A226N589|A0A226N589_CALSU Netrin receptor UNC5 OS=Callipepla squamata OX=9009 GN=ASZ78_010820 PE=3 SV=1
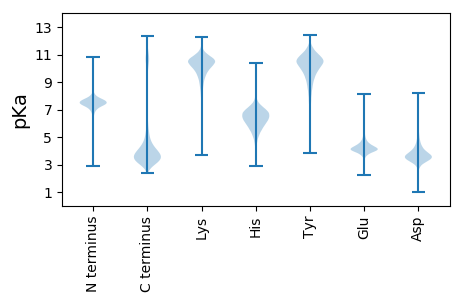
YYY2 pKa = 9.28DDD4 pKa = 3.53YYY6 pKa = 11.66AFCLSTVTNYYY17 pKa = 10.95NVIEEE22 pKa = 4.87NSDDD26 pKa = 3.31DDD28 pKa = 6.01DD29 pKa = 3.63EE30 pKa = 4.89DD31 pKa = 3.5KK32 pKa = 11.53HHH34 pKa = 6.82VEEE37 pKa = 4.84EE38 pKa = 4.18EE39 pKa = 4.42IADDD43 pKa = 4.27ADDD46 pKa = 3.86DDD48 pKa = 3.99SVPEEE53 pKa = 5.27DD54 pKa = 4.9DD55 pKa = 5.72PTDDD59 pKa = 3.44HH60 pKa = 7.03VLPEEE65 pKa = 3.68SEEE68 pKa = 4.46EEE70 pKa = 4.15STNSCWEEE78 pKa = 4.21DD79 pKa = 3.04EE80 pKa = 4.26KKK82 pKa = 9.57EE83 pKa = 3.96KKK85 pKa = 10.17EE86 pKa = 3.68LGPEEE91 pKa = 4.06QSDDD95 pKa = 4.14EE96 pKa = 4.49GCTVKKK102 pKa = 10.56EE103 pKa = 4.27DD104 pKa = 3.82EE105 pKa = 5.04DDD107 pKa = 3.28DDD109 pKa = 5.57EEE111 pKa = 4.27EEE113 pKa = 4.21NHHH116 pKa = 6.57DD117 pKa = 3.89NVEEE121 pKa = 3.95EE122 pKa = 5.53LQQEEE127 pKa = 4.53DD128 pKa = 4.03AVIYYY133 pKa = 10.37EEE135 pKa = 4.87PEEE138 pKa = 3.86EE139 pKa = 4.09DD140 pKa = 3.7RR141 pKa = 11.84QGTPEEE147 pKa = 4.14SGQDDD152 pKa = 3.64EE153 pKa = 4.34GEEE156 pKa = 4.24YY157 pKa = 9.49TSSVHHH163 pKa = 5.69KKK165 pKa = 10.73KK166 pKa = 10.16VLST
YYY2 pKa = 9.28DDD4 pKa = 3.53YYY6 pKa = 11.66AFCLSTVTNYYY17 pKa = 10.95NVIEEE22 pKa = 4.87NSDDD26 pKa = 3.31DDD28 pKa = 6.01DD29 pKa = 3.63EE30 pKa = 4.89DD31 pKa = 3.5KK32 pKa = 11.53HHH34 pKa = 6.82VEEE37 pKa = 4.84EE38 pKa = 4.18EE39 pKa = 4.42IADDD43 pKa = 4.27ADDD46 pKa = 3.86DDD48 pKa = 3.99SVPEEE53 pKa = 5.27DD54 pKa = 4.9DD55 pKa = 5.72PTDDD59 pKa = 3.44HH60 pKa = 7.03VLPEEE65 pKa = 3.68SEEE68 pKa = 4.46EEE70 pKa = 4.15STNSCWEEE78 pKa = 4.21DD79 pKa = 3.04EE80 pKa = 4.26KKK82 pKa = 9.57EE83 pKa = 3.96KKK85 pKa = 10.17EE86 pKa = 3.68LGPEEE91 pKa = 4.06QSDDD95 pKa = 4.14EE96 pKa = 4.49GCTVKKK102 pKa = 10.56EE103 pKa = 4.27DD104 pKa = 3.82EE105 pKa = 5.04DDD107 pKa = 3.28DDD109 pKa = 5.57EEE111 pKa = 4.27EEE113 pKa = 4.21NHHH116 pKa = 6.57DD117 pKa = 3.89NVEEE121 pKa = 3.95EE122 pKa = 5.53LQQEEE127 pKa = 4.53DD128 pKa = 4.03AVIYYY133 pKa = 10.37EEE135 pKa = 4.87PEEE138 pKa = 3.86EE139 pKa = 4.09DD140 pKa = 3.7RR141 pKa = 11.84QGTPEEE147 pKa = 4.14SGQDDD152 pKa = 3.64EE153 pKa = 4.34GEEE156 pKa = 4.24YY157 pKa = 9.49TSSVHHH163 pKa = 5.69KKK165 pKa = 10.73KK166 pKa = 10.16VLST
Molecular weight: 18.78 kDa
Isoelectric point according different methods:
Protein with the highest isoelectric point:
>tr|A0A226MFK8|A0A226MFK8_CALSU MPN domain-containing protein (Fragment) OS=Callipepla squamata OX=9009 GN=ASZ78_005586 PE=3 SV=1
MM1 pKa = 7.55TFLLFNNLFQKK12 pKa = 10.19SLKK15 pKa = 9.71QRR17 pKa = 11.84LGKK20 pKa = 10.77SNIQARR26 pKa = 11.84LGRR29 pKa = 11.84PAGPLARR36 pKa = 11.84GAMGGRR42 pKa = 11.84GLAMGQRR49 pKa = 11.84GLPRR53 pKa = 11.84GAMRR57 pKa = 11.84GGRR60 pKa = 11.84GARR63 pKa = 11.84ALLRR67 pKa = 11.84GGLPLRR73 pKa = 11.84GQGLLRR79 pKa = 11.84GGRR82 pKa = 11.84GMSPRR87 pKa = 11.84MGLRR91 pKa = 11.84RR92 pKa = 11.84GGIRR96 pKa = 11.84GRR98 pKa = 11.84GGPGRR103 pKa = 11.84GAMGRR108 pKa = 11.84GAMGRR113 pKa = 11.84GGLGGRR119 pKa = 11.84GQWAGTT125 pKa = 3.58
MM1 pKa = 7.55TFLLFNNLFQKK12 pKa = 10.19SLKK15 pKa = 9.71QRR17 pKa = 11.84LGKK20 pKa = 10.77SNIQARR26 pKa = 11.84LGRR29 pKa = 11.84PAGPLARR36 pKa = 11.84GAMGGRR42 pKa = 11.84GLAMGQRR49 pKa = 11.84GLPRR53 pKa = 11.84GAMRR57 pKa = 11.84GGRR60 pKa = 11.84GARR63 pKa = 11.84ALLRR67 pKa = 11.84GGLPLRR73 pKa = 11.84GQGLLRR79 pKa = 11.84GGRR82 pKa = 11.84GMSPRR87 pKa = 11.84MGLRR91 pKa = 11.84RR92 pKa = 11.84GGIRR96 pKa = 11.84GRR98 pKa = 11.84GGPGRR103 pKa = 11.84GAMGRR108 pKa = 11.84GAMGRR113 pKa = 11.84GGLGGRR119 pKa = 11.84GQWAGTT125 pKa = 3.58
Molecular weight: 12.87 kDa
Isoelectric point according different methods:
Peptides (in silico digests for buttom-up proteomics)
Below you can find in silico digests of the whole proteome with Trypsin, Chymotrypsin, Trypsin+LysC, LysN, ArgC proteases suitable for different mass spec machines.| Try ESI |
 |
|---|
| ChTry ESI |
|
|---|
| ArgC ESI |
|
|---|
| LysN ESI |
|
|---|
| TryLysC ESI |
|
|---|
| Try MALDI |
|
|---|
| ChTry MALDI |
|
|---|
| ArgC MALDI |
|
|---|
| LysN MALDI |
|
|---|
| TryLysC MALDI |
|
|---|
| Try LTQ |
|
|---|
| ChTry LTQ |
|
|---|
| ArgC LTQ |
|
|---|
| LysN LTQ |
|
|---|
| TryLysC LTQ |
|
|---|
| Try MSlow |
|
|---|
| ChTry MSlow |
|
|---|
| ArgC MSlow |
|
|---|
| LysN MSlow |
|
|---|
| TryLysC MSlow |
|
|---|
| Try MShigh |
|
|---|
| ChTry MShigh |
|
|---|
| ArgC MShigh |
|
|---|
| LysN MShigh |
|
|---|
| TryLysC MShigh |
|
|---|
General Statistics
Number of major isoforms |
Number of additional isoforms |
Number of all proteins |
Number of amino acids |
Min. Seq. Length |
Max. Seq. Length |
Avg. Seq. Length |
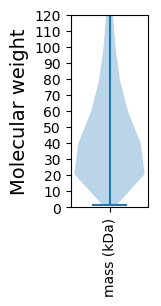
Avg. Mol. Weight |
|---|---|---|---|---|---|---|---|
0 |
8302635 |
11 |
17299 |
489.2 |
54.65 |
Amino acid frequency
Ala |
Cys |
Asp |
Glu |
Phe |
Gly |
His |
Ile |
Lys |
Leu |
|---|---|---|---|---|---|---|---|---|---|
7.04 ± 0.02 | 2.249 ± 0.018 |
4.991 ± 0.013 | 7.348 ± 0.028 |
3.726 ± 0.015 | 6.199 ± 0.024 |
2.484 ± 0.008 | 4.589 ± 0.016 |
5.992 ± 0.027 | 9.773 ± 0.027 |
Met |
Asn |
Gln |
Pro |
Arg |
Ser |
Thr |
Val |
Trp |
Tyr |
|---|---|---|---|---|---|---|---|---|---|
2.246 ± 0.009 | 3.832 ± 0.014 |
5.576 ± 0.027 | 4.636 ± 0.019 |
5.455 ± 0.016 | 8.281 ± 0.026 |
5.238 ± 0.017 | 6.35 ± 0.016 |
1.166 ± 0.007 | 2.819 ± 0.011 |
Most of the basic statistics you can see at this page can be downloaded from this CSV file
See this proteome in:

Proteome-pI is available under Creative Commons Attribution-NoDerivs license, for more details see here
| Reference: Kozlowski LP. Proteome-pI 2.0: Proteome Isoelectric Point Database Update. Nucleic Acids Res. 2021, doi: 10.1093/nar/gkab944 | Contact: Lukasz P. Kozlowski |