Podoviridae sp. ctpVR23
Taxonomy: Viruses; Duplodnaviria; Heunggongvirae; Uroviricota; Caudoviricetes; Caudovirales; Podoviridae; unclassified Podoviridae
Average proteome isoelectric point is 6.29
Get precalculated fractions of proteins
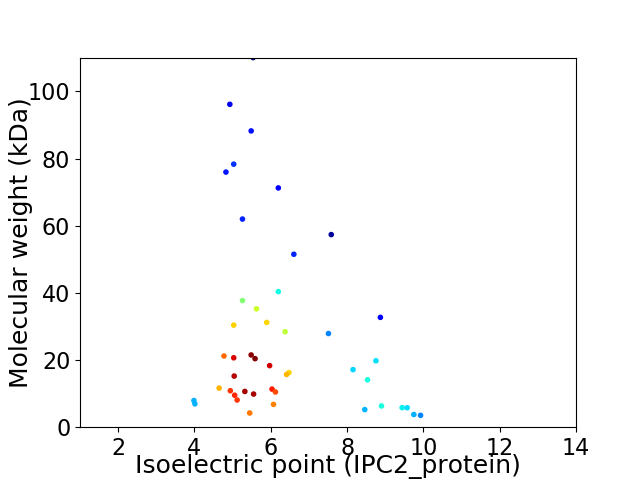
Virtual 2D-PAGE plot for 46 proteins (isoelectric point calculated using IPC2_protein)
Get csv file with sequences according to given criteria:
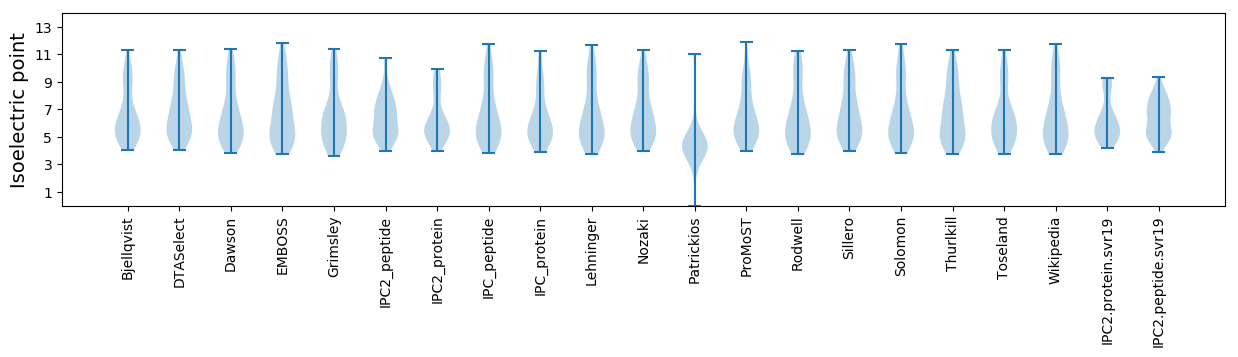
* You can choose from 21 different methods for calculating isoelectric point
Summary statistics related to proteome-wise predictions
Protein with the lowest isoelectric point:
>tr|A0A5Q2W650|A0A5Q2W650_9CAUD Uncharacterized protein OS=Podoviridae sp. ctpVR23 OX=2656714 PE=4 SV=1
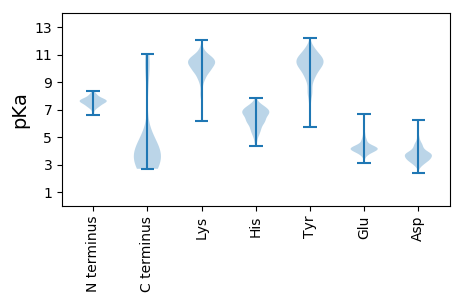
MM1 pKa = 7.1YY2 pKa = 10.32APYY5 pKa = 9.72PNRR8 pKa = 11.84YY9 pKa = 8.24QVEE12 pKa = 4.39QIRR15 pKa = 11.84KK16 pKa = 8.74LAEE19 pKa = 3.68QGLDD23 pKa = 3.04ADD25 pKa = 4.67EE26 pKa = 5.06ISRR29 pKa = 11.84QIQVDD34 pKa = 3.8VEE36 pKa = 4.49GVLVHH41 pKa = 6.83LEE43 pKa = 3.79QLEE46 pKa = 4.47DD47 pKa = 3.76IEE49 pKa = 6.08LSDD52 pKa = 4.16PEE54 pKa = 4.18QGSEE58 pKa = 4.14EE59 pKa = 4.23EE60 pKa = 4.17
MM1 pKa = 7.1YY2 pKa = 10.32APYY5 pKa = 9.72PNRR8 pKa = 11.84YY9 pKa = 8.24QVEE12 pKa = 4.39QIRR15 pKa = 11.84KK16 pKa = 8.74LAEE19 pKa = 3.68QGLDD23 pKa = 3.04ADD25 pKa = 4.67EE26 pKa = 5.06ISRR29 pKa = 11.84QIQVDD34 pKa = 3.8VEE36 pKa = 4.49GVLVHH41 pKa = 6.83LEE43 pKa = 3.79QLEE46 pKa = 4.47DD47 pKa = 3.76IEE49 pKa = 6.08LSDD52 pKa = 4.16PEE54 pKa = 4.18QGSEE58 pKa = 4.14EE59 pKa = 4.23EE60 pKa = 4.17
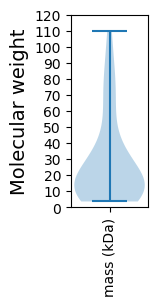
Molecular weight: 6.94 kDa
Isoelectric point according different methods:
Protein with the highest isoelectric point:
>tr|A0A5Q2WCC4|A0A5Q2WCC4_9CAUD Uncharacterized protein OS=Podoviridae sp. ctpVR23 OX=2656714 PE=4 SV=1
MM1 pKa = 7.36GSAAGGFRR9 pKa = 11.84RR10 pKa = 11.84SATDD14 pKa = 3.6SIFMGTWSCPVTSTPLRR31 pKa = 11.84GRR33 pKa = 11.84YY34 pKa = 7.45FF35 pKa = 3.39
MM1 pKa = 7.36GSAAGGFRR9 pKa = 11.84RR10 pKa = 11.84SATDD14 pKa = 3.6SIFMGTWSCPVTSTPLRR31 pKa = 11.84GRR33 pKa = 11.84YY34 pKa = 7.45FF35 pKa = 3.39
Molecular weight: 3.77 kDa
Isoelectric point according different methods:
Peptides (in silico digests for buttom-up proteomics)
Below you can find in silico digests of the whole proteome with Trypsin, Chymotrypsin, Trypsin+LysC, LysN, ArgC proteases suitable for different mass spec machines.| Try ESI |
 |
|---|
| ChTry ESI |
|
|---|
| ArgC ESI |
|
|---|
| LysN ESI |
|
|---|
| TryLysC ESI |
|
|---|
| Try MALDI |
|
|---|
| ChTry MALDI |
|
|---|
| ArgC MALDI |
|
|---|
| LysN MALDI |
|
|---|
| TryLysC MALDI |
|
|---|
| Try LTQ |
|
|---|
| ChTry LTQ |
|
|---|
| ArgC LTQ |
|
|---|
| LysN LTQ |
|
|---|
| TryLysC LTQ |
|
|---|
| Try MSlow |
|
|---|
| ChTry MSlow |
|
|---|
| ArgC MSlow |
|
|---|
| LysN MSlow |
|
|---|
| TryLysC MSlow |
|
|---|
| Try MShigh |
|
|---|
| ChTry MShigh |
|
|---|
| ArgC MShigh |
|
|---|
| LysN MShigh |
|
|---|
| TryLysC MShigh |
|
|---|
General Statistics
Number of major isoforms |
Number of additional isoforms |
Number of all proteins |
Number of amino acids |
Min. Seq. Length |
Max. Seq. Length |
Avg. Seq. Length |
Avg. Mol. Weight |
|---|---|---|---|---|---|---|---|
0 |
11604 |
30 |
1006 |
252.3 |
28.14 |
Amino acid frequency
Ala |
Cys |
Asp |
Glu |
Phe |
Gly |
His |
Ile |
Lys |
Leu |
|---|---|---|---|---|---|---|---|---|---|
9.152 ± 0.503 | 1.198 ± 0.204 |
6.36 ± 0.231 | 6.463 ± 0.266 |
3.464 ± 0.189 | 6.782 ± 0.328 |
1.767 ± 0.203 | 5.722 ± 0.234 |
5.653 ± 0.35 | 7.385 ± 0.27 |
Met |
Asn |
Gln |
Pro |
Arg |
Ser |
Thr |
Val |
Trp |
Tyr |
|---|---|---|---|---|---|---|---|---|---|
3.102 ± 0.172 | 4.361 ± 0.153 |
4.033 ± 0.226 | 3.878 ± 0.283 |
5.886 ± 0.274 | 6.705 ± 0.365 |
5.989 ± 0.413 | 7.118 ± 0.283 |
1.698 ± 0.177 | 3.283 ± 0.151 |
Most of the basic statistics you can see at this page can be downloaded from this CSV file
See this proteome in:

Proteome-pI is available under Creative Commons Attribution-NoDerivs license, for more details see here
| Reference: Kozlowski LP. Proteome-pI 2.0: Proteome Isoelectric Point Database Update. Nucleic Acids Res. 2021, doi: 10.1093/nar/gkab944 | Contact: Lukasz P. Kozlowski |