Salmonella phage 35
Taxonomy: Viruses; Duplodnaviria; Heunggongvirae; Uroviricota; Caudoviricetes; Caudovirales; Siphoviridae; Chivirus; Salmonella virus 35
Average proteome isoelectric point is 6.5
Get precalculated fractions of proteins
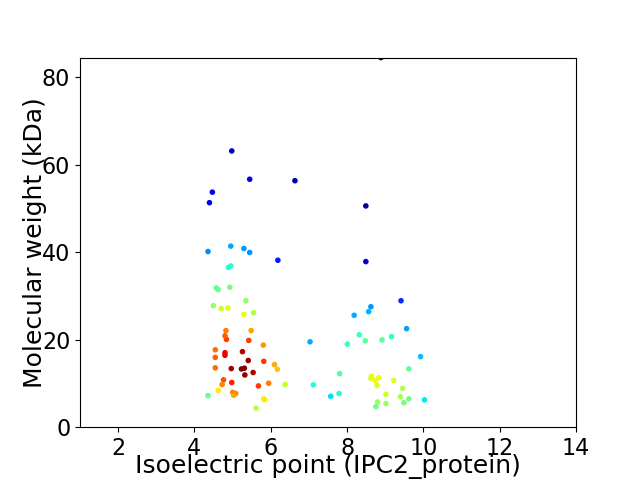
Virtual 2D-PAGE plot for 91 proteins (isoelectric point calculated using IPC2_protein)
Get csv file with sequences according to given criteria:
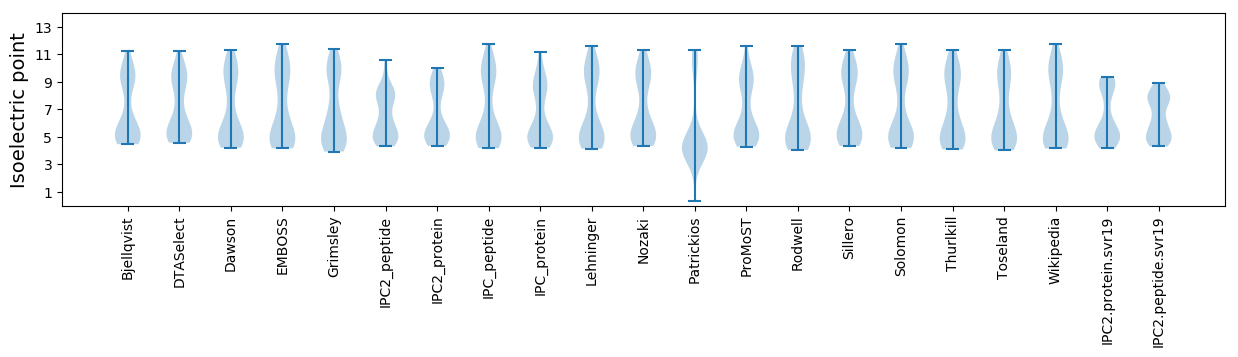
* You can choose from 21 different methods for calculating isoelectric point
Summary statistics related to proteome-wise predictions
Protein with the lowest isoelectric point:
>tr|A0A0N7CFH9|A0A0N7CFH9_9CAUD Uncharacterized protein OS=Salmonella phage 35 OX=1654888 GN=SP35_8 PE=4 SV=1
MM1 pKa = 7.41AGLWFFVVTMCGAVGADD18 pKa = 4.02NMAADD23 pKa = 3.87CHH25 pKa = 7.17DD26 pKa = 3.9YY27 pKa = 11.38VIDD30 pKa = 4.68AGISYY35 pKa = 10.1DD36 pKa = 3.54DD37 pKa = 4.13CRR39 pKa = 11.84AAVAAYY45 pKa = 8.14PGRR48 pKa = 11.84IGLYY52 pKa = 8.41SARR55 pKa = 11.84CDD57 pKa = 2.91RR58 pKa = 11.84GEE60 pKa = 3.96VVEE63 pKa = 4.71GGNHH67 pKa = 4.72EE68 pKa = 4.2
MM1 pKa = 7.41AGLWFFVVTMCGAVGADD18 pKa = 4.02NMAADD23 pKa = 3.87CHH25 pKa = 7.17DD26 pKa = 3.9YY27 pKa = 11.38VIDD30 pKa = 4.68AGISYY35 pKa = 10.1DD36 pKa = 3.54DD37 pKa = 4.13CRR39 pKa = 11.84AAVAAYY45 pKa = 8.14PGRR48 pKa = 11.84IGLYY52 pKa = 8.41SARR55 pKa = 11.84CDD57 pKa = 2.91RR58 pKa = 11.84GEE60 pKa = 3.96VVEE63 pKa = 4.71GGNHH67 pKa = 4.72EE68 pKa = 4.2
Molecular weight: 7.21 kDa
Isoelectric point according different methods:
Protein with the highest isoelectric point:
>tr|A0A0N6WGD7|A0A0N6WGD7_9CAUD Putative tail component K-like protein OS=Salmonella phage 35 OX=1654888 GN=SP35_86 PE=4 SV=1
MM1 pKa = 7.61LFEE4 pKa = 5.51CIAKK8 pKa = 10.18RR9 pKa = 11.84SFRR12 pKa = 11.84EE13 pKa = 3.52SRR15 pKa = 11.84YY16 pKa = 9.85GLFVNVRR23 pKa = 11.84QVQDD27 pKa = 3.33QAVQRR32 pKa = 11.84LDD34 pKa = 3.63LLVTFVGRR42 pKa = 11.84VVQRR46 pKa = 11.84ARR48 pKa = 11.84CKK50 pKa = 10.47IMAFSS55 pKa = 3.56
MM1 pKa = 7.61LFEE4 pKa = 5.51CIAKK8 pKa = 10.18RR9 pKa = 11.84SFRR12 pKa = 11.84EE13 pKa = 3.52SRR15 pKa = 11.84YY16 pKa = 9.85GLFVNVRR23 pKa = 11.84QVQDD27 pKa = 3.33QAVQRR32 pKa = 11.84LDD34 pKa = 3.63LLVTFVGRR42 pKa = 11.84VVQRR46 pKa = 11.84ARR48 pKa = 11.84CKK50 pKa = 10.47IMAFSS55 pKa = 3.56
Molecular weight: 6.48 kDa
Isoelectric point according different methods:
Peptides (in silico digests for buttom-up proteomics)
Below you can find in silico digests of the whole proteome with Trypsin, Chymotrypsin, Trypsin+LysC, LysN, ArgC proteases suitable for different mass spec machines.| Try ESI |
 |
|---|
| ChTry ESI |
|
|---|
| ArgC ESI |
|
|---|
| LysN ESI |
|
|---|
| TryLysC ESI |
|
|---|
| Try MALDI |
|
|---|
| ChTry MALDI |
|
|---|
| ArgC MALDI |
|
|---|
| LysN MALDI |
|
|---|
| TryLysC MALDI |
|
|---|
| Try LTQ |
|
|---|
| ChTry LTQ |
|
|---|
| ArgC LTQ |
|
|---|
| LysN LTQ |
|
|---|
| TryLysC LTQ |
|
|---|
| Try MSlow |
|
|---|
| ChTry MSlow |
|
|---|
| ArgC MSlow |
|
|---|
| LysN MSlow |
|
|---|
| TryLysC MSlow |
|
|---|
| Try MShigh |
|
|---|
| ChTry MShigh |
|
|---|
| ArgC MShigh |
|
|---|
| LysN MShigh |
|
|---|
| TryLysC MShigh |
|
|---|
General Statistics
Number of major isoforms |
Number of additional isoforms |
Number of all proteins |
Number of amino acids |
Min. Seq. Length |
Max. Seq. Length |
Avg. Seq. Length |
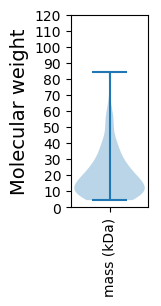
Avg. Mol. Weight |
|---|---|---|---|---|---|---|---|
0 |
16922 |
41 |
778 |
186.0 |
20.72 |
Amino acid frequency
Ala |
Cys |
Asp |
Glu |
Phe |
Gly |
His |
Ile |
Lys |
Leu |
|---|---|---|---|---|---|---|---|---|---|
9.715 ± 0.469 | 1.04 ± 0.102 |
6.63 ± 0.264 | 5.898 ± 0.306 |
3.41 ± 0.158 | 7.121 ± 0.261 |
1.672 ± 0.137 | 5.372 ± 0.203 |
4.946 ± 0.256 | 7.369 ± 0.22 |
Met |
Asn |
Gln |
Pro |
Arg |
Ser |
Thr |
Val |
Trp |
Tyr |
|---|---|---|---|---|---|---|---|---|---|
3.156 ± 0.147 | 4.107 ± 0.178 |
4.881 ± 0.345 | 3.841 ± 0.302 |
6.536 ± 0.239 | 5.649 ± 0.222 |
6.441 ± 0.322 | 7.02 ± 0.21 |
1.696 ± 0.128 | 3.498 ± 0.145 |
Most of the basic statistics you can see at this page can be downloaded from this CSV file
See this proteome in:

Proteome-pI is available under Creative Commons Attribution-NoDerivs license, for more details see here
| Reference: Kozlowski LP. Proteome-pI 2.0: Proteome Isoelectric Point Database Update. Nucleic Acids Res. 2021, doi: 10.1093/nar/gkab944 | Contact: Lukasz P. Kozlowski |