Tamilnaduibacter salinus
Taxonomy: cellular organisms; Bacteria; Proteobacteria; Gammaproteobacteria; Alteromonadales; Alteromonadaceae; Tamilnaduibacter
Average proteome isoelectric point is 6.02
Get precalculated fractions of proteins
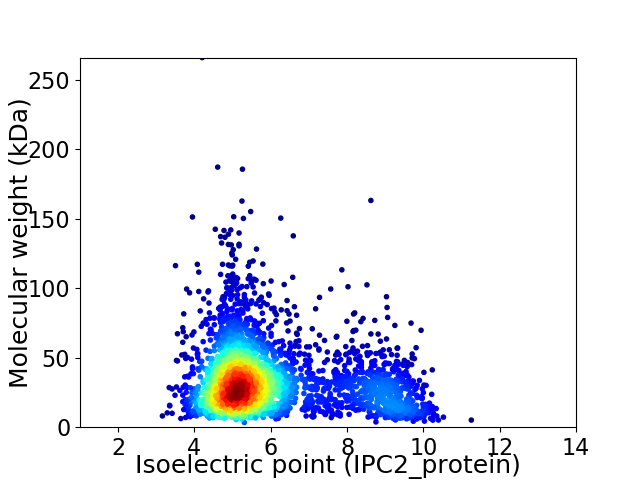
Virtual 2D-PAGE plot for 3136 proteins (isoelectric point calculated using IPC2_protein)
Get csv file with sequences according to given criteria:
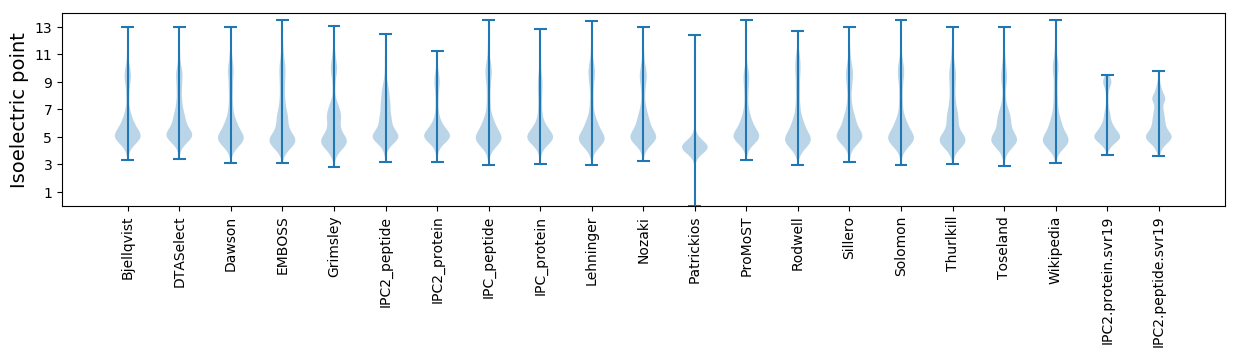
* You can choose from 21 different methods for calculating isoelectric point
Summary statistics related to proteome-wise predictions
Protein with the lowest isoelectric point:
>tr|A0A2A2I0E8|A0A2A2I0E8_9ALTE Serine hydroxymethyltransferase OS=Tamilnaduibacter salinus OX=1484056 GN=glyA PE=3 SV=1
MM1 pKa = 7.66PRR3 pKa = 11.84TIPVLACITTLTLLSACGGGSQNLDD28 pKa = 3.26TGSGGSCGAAFNPAATVRR46 pKa = 11.84LSLGNFTISDD56 pKa = 4.35PEE58 pKa = 4.19PLSEE62 pKa = 4.55TLLSDD67 pKa = 4.62LAQGTQPNSSATPAKK82 pKa = 9.75QDD84 pKa = 3.26YY85 pKa = 9.48GNQVHH90 pKa = 6.96SDD92 pKa = 4.32LLTQSQPFIGSTSDD106 pKa = 2.85EE107 pKa = 5.04DD108 pKa = 4.07YY109 pKa = 11.18NQARR113 pKa = 11.84NPYY116 pKa = 10.2DD117 pKa = 3.59LMNKK121 pKa = 9.34VIASGEE127 pKa = 3.92VDD129 pKa = 3.28NFNAGRR135 pKa = 11.84GYY137 pKa = 10.35ISDD140 pKa = 5.37CIDD143 pKa = 3.38AGNPAEE149 pKa = 4.38YY150 pKa = 10.61SNSANNVTIQFNEE163 pKa = 4.07VQNEE167 pKa = 3.93NTTEE171 pKa = 3.97QFRR174 pKa = 11.84YY175 pKa = 8.41PQLRR179 pKa = 11.84WVYY182 pKa = 10.14TPATTNTVQRR192 pKa = 11.84VVRR195 pKa = 11.84YY196 pKa = 9.62QGGDD200 pKa = 3.31FLDD203 pKa = 4.34GLTVGSSFASSTFSTTGYY221 pKa = 9.8NAPQRR226 pKa = 11.84VEE228 pKa = 3.81ASFAADD234 pKa = 3.84SNDD237 pKa = 3.25EE238 pKa = 4.58DD239 pKa = 4.14SQQSLIIVQRR249 pKa = 11.84FVDD252 pKa = 4.15PDD254 pKa = 3.57QPDD257 pKa = 3.41DD258 pKa = 5.06RR259 pKa = 11.84QDD261 pKa = 2.66EE262 pKa = 4.34WLYY265 pKa = 11.52SDD267 pKa = 3.5TTGTTFDD274 pKa = 3.64FAGATDD280 pKa = 3.69VDD282 pKa = 4.36CARR285 pKa = 11.84VLVDD289 pKa = 3.87YY290 pKa = 10.95DD291 pKa = 3.47MQKK294 pKa = 11.07AYY296 pKa = 11.08VFTSSDD302 pKa = 3.72EE303 pKa = 4.49PSDD306 pKa = 3.77SPAYY310 pKa = 10.02CGNRR314 pKa = 11.84AMDD317 pKa = 4.36EE318 pKa = 4.15SDD320 pKa = 3.63NDD322 pKa = 3.84YY323 pKa = 8.06PTQPVSEE330 pKa = 4.37RR331 pKa = 11.84KK332 pKa = 7.51QQ333 pKa = 3.14
MM1 pKa = 7.66PRR3 pKa = 11.84TIPVLACITTLTLLSACGGGSQNLDD28 pKa = 3.26TGSGGSCGAAFNPAATVRR46 pKa = 11.84LSLGNFTISDD56 pKa = 4.35PEE58 pKa = 4.19PLSEE62 pKa = 4.55TLLSDD67 pKa = 4.62LAQGTQPNSSATPAKK82 pKa = 9.75QDD84 pKa = 3.26YY85 pKa = 9.48GNQVHH90 pKa = 6.96SDD92 pKa = 4.32LLTQSQPFIGSTSDD106 pKa = 2.85EE107 pKa = 5.04DD108 pKa = 4.07YY109 pKa = 11.18NQARR113 pKa = 11.84NPYY116 pKa = 10.2DD117 pKa = 3.59LMNKK121 pKa = 9.34VIASGEE127 pKa = 3.92VDD129 pKa = 3.28NFNAGRR135 pKa = 11.84GYY137 pKa = 10.35ISDD140 pKa = 5.37CIDD143 pKa = 3.38AGNPAEE149 pKa = 4.38YY150 pKa = 10.61SNSANNVTIQFNEE163 pKa = 4.07VQNEE167 pKa = 3.93NTTEE171 pKa = 3.97QFRR174 pKa = 11.84YY175 pKa = 8.41PQLRR179 pKa = 11.84WVYY182 pKa = 10.14TPATTNTVQRR192 pKa = 11.84VVRR195 pKa = 11.84YY196 pKa = 9.62QGGDD200 pKa = 3.31FLDD203 pKa = 4.34GLTVGSSFASSTFSTTGYY221 pKa = 9.8NAPQRR226 pKa = 11.84VEE228 pKa = 3.81ASFAADD234 pKa = 3.84SNDD237 pKa = 3.25EE238 pKa = 4.58DD239 pKa = 4.14SQQSLIIVQRR249 pKa = 11.84FVDD252 pKa = 4.15PDD254 pKa = 3.57QPDD257 pKa = 3.41DD258 pKa = 5.06RR259 pKa = 11.84QDD261 pKa = 2.66EE262 pKa = 4.34WLYY265 pKa = 11.52SDD267 pKa = 3.5TTGTTFDD274 pKa = 3.64FAGATDD280 pKa = 3.69VDD282 pKa = 4.36CARR285 pKa = 11.84VLVDD289 pKa = 3.87YY290 pKa = 10.95DD291 pKa = 3.47MQKK294 pKa = 11.07AYY296 pKa = 11.08VFTSSDD302 pKa = 3.72EE303 pKa = 4.49PSDD306 pKa = 3.77SPAYY310 pKa = 10.02CGNRR314 pKa = 11.84AMDD317 pKa = 4.36EE318 pKa = 4.15SDD320 pKa = 3.63NDD322 pKa = 3.84YY323 pKa = 8.06PTQPVSEE330 pKa = 4.37RR331 pKa = 11.84KK332 pKa = 7.51QQ333 pKa = 3.14
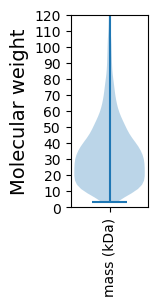
Molecular weight: 36.11 kDa
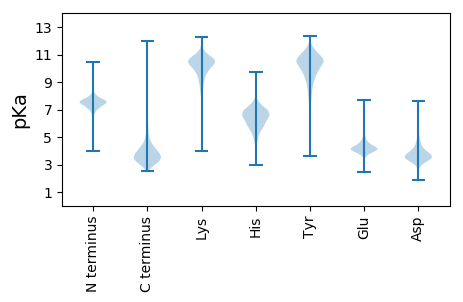
Isoelectric point according different methods:
Protein with the highest isoelectric point:
>tr|A0A2A2I7A1|A0A2A2I7A1_9ALTE NADH dehydrogenase I subunit E OS=Tamilnaduibacter salinus OX=1484056 GN=CF392_02130 PE=3 SV=1
MM1 pKa = 7.45KK2 pKa = 9.51RR3 pKa = 11.84TFQPSVLKK11 pKa = 10.42RR12 pKa = 11.84KK13 pKa = 9.04RR14 pKa = 11.84AHH16 pKa = 6.12GFRR19 pKa = 11.84ARR21 pKa = 11.84MATANGRR28 pKa = 11.84KK29 pKa = 9.32VIARR33 pKa = 11.84RR34 pKa = 11.84RR35 pKa = 11.84AKK37 pKa = 9.91GRR39 pKa = 11.84KK40 pKa = 8.85RR41 pKa = 11.84LSAA44 pKa = 3.96
MM1 pKa = 7.45KK2 pKa = 9.51RR3 pKa = 11.84TFQPSVLKK11 pKa = 10.42RR12 pKa = 11.84KK13 pKa = 9.04RR14 pKa = 11.84AHH16 pKa = 6.12GFRR19 pKa = 11.84ARR21 pKa = 11.84MATANGRR28 pKa = 11.84KK29 pKa = 9.32VIARR33 pKa = 11.84RR34 pKa = 11.84RR35 pKa = 11.84AKK37 pKa = 9.91GRR39 pKa = 11.84KK40 pKa = 8.85RR41 pKa = 11.84LSAA44 pKa = 3.96
Molecular weight: 5.12 kDa
Isoelectric point according different methods:
Peptides (in silico digests for buttom-up proteomics)
Below you can find in silico digests of the whole proteome with Trypsin, Chymotrypsin, Trypsin+LysC, LysN, ArgC proteases suitable for different mass spec machines.| Try ESI |
 |
|---|
| ChTry ESI |
|
|---|
| ArgC ESI |
|
|---|
| LysN ESI |
|
|---|
| TryLysC ESI |
|
|---|
| Try MALDI |
|
|---|
| ChTry MALDI |
|
|---|
| ArgC MALDI |
|
|---|
| LysN MALDI |
|
|---|
| TryLysC MALDI |
|
|---|
| Try LTQ |
|
|---|
| ChTry LTQ |
|
|---|
| ArgC LTQ |
|
|---|
| LysN LTQ |
|
|---|
| TryLysC LTQ |
|
|---|
| Try MSlow |
|
|---|
| ChTry MSlow |
|
|---|
| ArgC MSlow |
|
|---|
| LysN MSlow |
|
|---|
| TryLysC MSlow |
|
|---|
| Try MShigh |
|
|---|
| ChTry MShigh |
|
|---|
| ArgC MShigh |
|
|---|
| LysN MShigh |
|
|---|
| TryLysC MShigh |
|
|---|
General Statistics
Number of major isoforms |
Number of additional isoforms |
Number of all proteins |
Number of amino acids |
Min. Seq. Length |
Max. Seq. Length |
Avg. Seq. Length |
Avg. Mol. Weight |
|---|---|---|---|---|---|---|---|
0 |
1009489 |
31 |
2419 |
321.9 |
35.58 |
Amino acid frequency
Ala |
Cys |
Asp |
Glu |
Phe |
Gly |
His |
Ile |
Lys |
Leu |
|---|---|---|---|---|---|---|---|---|---|
9.75 ± 0.047 | 0.89 ± 0.013 |
6.403 ± 0.041 | 6.51 ± 0.041 |
3.58 ± 0.03 | 7.927 ± 0.039 |
2.344 ± 0.023 | 4.829 ± 0.03 |
2.921 ± 0.036 | 10.504 ± 0.056 |
Met |
Asn |
Gln |
Pro |
Arg |
Ser |
Thr |
Val |
Trp |
Tyr |
|---|---|---|---|---|---|---|---|---|---|
2.5 ± 0.017 | 2.992 ± 0.026 |
4.89 ± 0.029 | 4.13 ± 0.028 |
7.408 ± 0.049 | 5.912 ± 0.029 |
5.381 ± 0.03 | 7.245 ± 0.041 |
1.409 ± 0.02 | 2.474 ± 0.02 |
Most of the basic statistics you can see at this page can be downloaded from this CSV file
See this proteome in:

Proteome-pI is available under Creative Commons Attribution-NoDerivs license, for more details see here
| Reference: Kozlowski LP. Proteome-pI 2.0: Proteome Isoelectric Point Database Update. Nucleic Acids Res. 2021, doi: 10.1093/nar/gkab944 | Contact: Lukasz P. Kozlowski |