Streptomyces scabichelini
Taxonomy: cellular organisms; Bacteria; Terrabacteria group; Actinobacteria; Actinomycetia; Streptomycetales; Streptomycetaceae; Streptomyces
Average proteome isoelectric point is 6.24
Get precalculated fractions of proteins
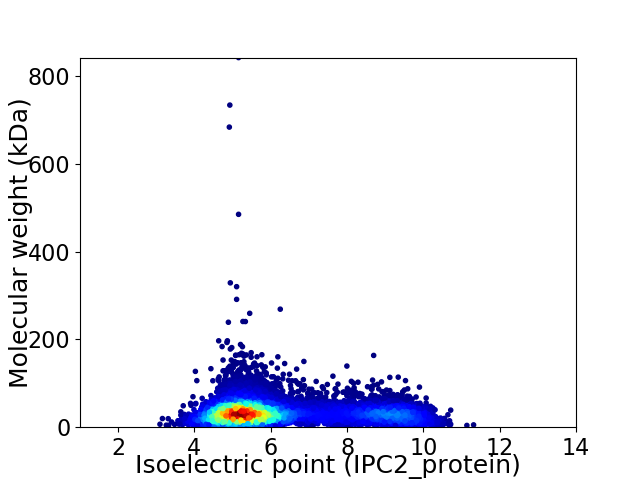
Virtual 2D-PAGE plot for 9567 proteins (isoelectric point calculated using IPC2_protein)
Get csv file with sequences according to given criteria:
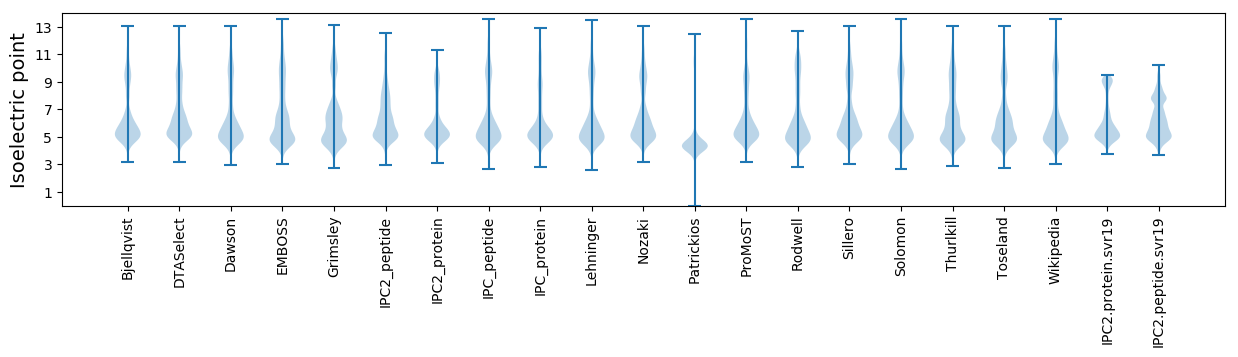
* You can choose from 21 different methods for calculating isoelectric point
Summary statistics related to proteome-wise predictions
Protein with the lowest isoelectric point:
>tr|A0A6G4VF27|A0A6G4VF27_9ACTN Amino acid ABC transporter permease OS=Streptomyces scabichelini OX=2711217 GN=G5C60_35080 PE=3 SV=1
MM1 pKa = 7.15AQKK4 pKa = 10.53SYY6 pKa = 9.67TVTGMSCEE14 pKa = 3.88HH15 pKa = 6.83CAASITEE22 pKa = 4.26EE23 pKa = 4.15VSDD26 pKa = 4.08VPGVTDD32 pKa = 3.4VVVDD36 pKa = 4.18LASNVVTVHH45 pKa = 5.37ATEE48 pKa = 5.16LDD50 pKa = 3.78DD51 pKa = 4.63DD52 pKa = 4.09QVRR55 pKa = 11.84AAIVEE60 pKa = 3.97AGYY63 pKa = 10.87GVDD66 pKa = 4.06EE67 pKa = 4.58PASVV71 pKa = 3.11
MM1 pKa = 7.15AQKK4 pKa = 10.53SYY6 pKa = 9.67TVTGMSCEE14 pKa = 3.88HH15 pKa = 6.83CAASITEE22 pKa = 4.26EE23 pKa = 4.15VSDD26 pKa = 4.08VPGVTDD32 pKa = 3.4VVVDD36 pKa = 4.18LASNVVTVHH45 pKa = 5.37ATEE48 pKa = 5.16LDD50 pKa = 3.78DD51 pKa = 4.63DD52 pKa = 4.09QVRR55 pKa = 11.84AAIVEE60 pKa = 3.97AGYY63 pKa = 10.87GVDD66 pKa = 4.06EE67 pKa = 4.58PASVV71 pKa = 3.11
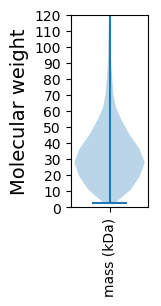
Molecular weight: 7.35 kDa
Isoelectric point according different methods:
Protein with the highest isoelectric point:
>tr|A0A6G4V5B5|A0A6G4V5B5_9ACTN MFS transporter OS=Streptomyces scabichelini OX=2711217 GN=G5C60_15855 PE=4 SV=1
MM1 pKa = 7.69SKK3 pKa = 9.0RR4 pKa = 11.84TFQPNNRR11 pKa = 11.84RR12 pKa = 11.84RR13 pKa = 11.84AKK15 pKa = 8.7THH17 pKa = 5.15GFRR20 pKa = 11.84LRR22 pKa = 11.84MRR24 pKa = 11.84TRR26 pKa = 11.84AGRR29 pKa = 11.84AILATRR35 pKa = 11.84RR36 pKa = 11.84GKK38 pKa = 10.48GRR40 pKa = 11.84ARR42 pKa = 11.84LSAA45 pKa = 3.91
MM1 pKa = 7.69SKK3 pKa = 9.0RR4 pKa = 11.84TFQPNNRR11 pKa = 11.84RR12 pKa = 11.84RR13 pKa = 11.84AKK15 pKa = 8.7THH17 pKa = 5.15GFRR20 pKa = 11.84LRR22 pKa = 11.84MRR24 pKa = 11.84TRR26 pKa = 11.84AGRR29 pKa = 11.84AILATRR35 pKa = 11.84RR36 pKa = 11.84GKK38 pKa = 10.48GRR40 pKa = 11.84ARR42 pKa = 11.84LSAA45 pKa = 3.91
Molecular weight: 5.27 kDa
Isoelectric point according different methods:
Peptides (in silico digests for buttom-up proteomics)
Below you can find in silico digests of the whole proteome with Trypsin, Chymotrypsin, Trypsin+LysC, LysN, ArgC proteases suitable for different mass spec machines.| Try ESI |
 |
|---|
| ChTry ESI |
|
|---|
| ArgC ESI |
|
|---|
| LysN ESI |
|
|---|
| TryLysC ESI |
|
|---|
| Try MALDI |
|
|---|
| ChTry MALDI |
|
|---|
| ArgC MALDI |
|
|---|
| LysN MALDI |
|
|---|
| TryLysC MALDI |
|
|---|
| Try LTQ |
|
|---|
| ChTry LTQ |
|
|---|
| ArgC LTQ |
|
|---|
| LysN LTQ |
|
|---|
| TryLysC LTQ |
|
|---|
| Try MSlow |
|
|---|
| ChTry MSlow |
|
|---|
| ArgC MSlow |
|
|---|
| LysN MSlow |
|
|---|
| TryLysC MSlow |
|
|---|
| Try MShigh |
|
|---|
| ChTry MShigh |
|
|---|
| ArgC MShigh |
|
|---|
| LysN MShigh |
|
|---|
| TryLysC MShigh |
|
|---|
General Statistics
Number of major isoforms |
Number of additional isoforms |
Number of all proteins |
Number of amino acids |
Min. Seq. Length |
Max. Seq. Length |
Avg. Seq. Length |
Avg. Mol. Weight |
|---|---|---|---|---|---|---|---|
0 |
3151775 |
20 |
7787 |
329.4 |
35.37 |
Amino acid frequency
Ala |
Cys |
Asp |
Glu |
Phe |
Gly |
His |
Ile |
Lys |
Leu |
|---|---|---|---|---|---|---|---|---|---|
13.143 ± 0.034 | 0.759 ± 0.006 |
6.058 ± 0.02 | 5.819 ± 0.023 |
2.782 ± 0.014 | 9.303 ± 0.026 |
2.273 ± 0.013 | 3.351 ± 0.014 |
2.275 ± 0.024 | 10.32 ± 0.035 |
Met |
Asn |
Gln |
Pro |
Arg |
Ser |
Thr |
Val |
Trp |
Tyr |
|---|---|---|---|---|---|---|---|---|---|
1.802 ± 0.009 | 1.863 ± 0.014 |
5.952 ± 0.02 | 2.852 ± 0.015 |
7.876 ± 0.028 | 5.281 ± 0.021 |
6.162 ± 0.019 | 8.441 ± 0.022 |
1.534 ± 0.011 | 2.153 ± 0.013 |
Most of the basic statistics you can see at this page can be downloaded from this CSV file
See this proteome in:

Proteome-pI is available under Creative Commons Attribution-NoDerivs license, for more details see here
| Reference: Kozlowski LP. Proteome-pI 2.0: Proteome Isoelectric Point Database Update. Nucleic Acids Res. 2021, doi: 10.1093/nar/gkab944 | Contact: Lukasz P. Kozlowski |