Pseudomonas phage phi2954
Taxonomy: Viruses; Riboviria; Orthornavirae; Duplornaviricota; Vidaverviricetes; Mindivirales; Cystoviridae; Cystovirus; Pseudomonas virus phi2954
Average proteome isoelectric point is 6.08
Get precalculated fractions of proteins
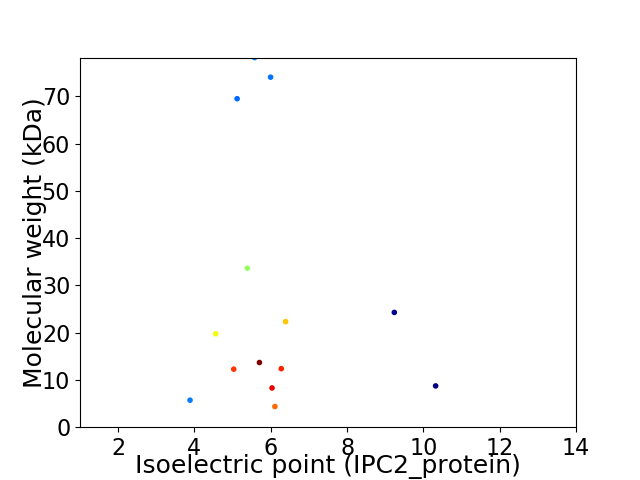
Virtual 2D-PAGE plot for 14 proteins (isoelectric point calculated using IPC2_protein)
Get csv file with sequences according to given criteria:
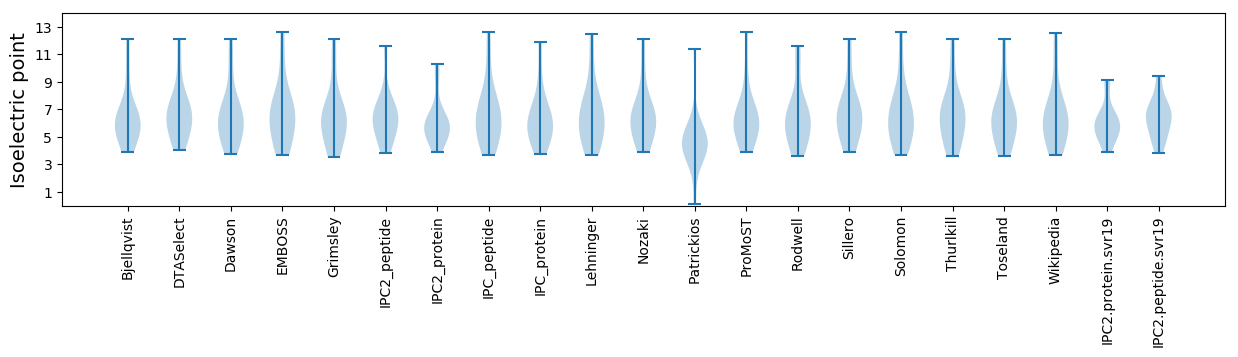
* You can choose from 21 different methods for calculating isoelectric point
Summary statistics related to proteome-wise predictions
Protein with the lowest isoelectric point:
>tr|C0KIT5|C0KIT5_9VIRU p15 OS=Pseudomonas phage phi2954 OX=593131 PE=4 SV=1
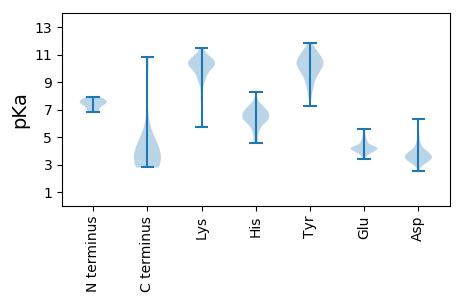
MM1 pKa = 7.53LKK3 pKa = 9.59VQCYY7 pKa = 7.69EE8 pKa = 3.9CGVIFNYY15 pKa = 10.54YY16 pKa = 10.4NEE18 pKa = 5.31DD19 pKa = 3.96DD20 pKa = 4.8NPPCDD25 pKa = 5.22SEE27 pKa = 4.75TCDD30 pKa = 3.1ACLDD34 pKa = 3.59KK35 pKa = 11.34FEE37 pKa = 4.72EE38 pKa = 4.23EE39 pKa = 5.03RR40 pKa = 11.84ITEE43 pKa = 3.82EE44 pKa = 4.95DD45 pKa = 3.59GCLKK49 pKa = 10.83
MM1 pKa = 7.53LKK3 pKa = 9.59VQCYY7 pKa = 7.69EE8 pKa = 3.9CGVIFNYY15 pKa = 10.54YY16 pKa = 10.4NEE18 pKa = 5.31DD19 pKa = 3.96DD20 pKa = 4.8NPPCDD25 pKa = 5.22SEE27 pKa = 4.75TCDD30 pKa = 3.1ACLDD34 pKa = 3.59KK35 pKa = 11.34FEE37 pKa = 4.72EE38 pKa = 4.23EE39 pKa = 5.03RR40 pKa = 11.84ITEE43 pKa = 3.82EE44 pKa = 4.95DD45 pKa = 3.59GCLKK49 pKa = 10.83
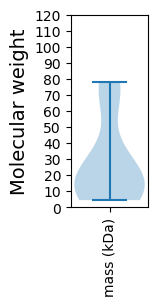
Molecular weight: 5.72 kDa
Isoelectric point according different methods:
Protein with the highest isoelectric point:
>tr|C0KIU2|C0KIU2_9VIRU p6 OS=Pseudomonas phage phi2954 OX=593131 PE=4 SV=1
MM1 pKa = 6.95AHH3 pKa = 6.53ARR5 pKa = 11.84ISTSTRR11 pKa = 11.84PTFSRR16 pKa = 11.84SLDD19 pKa = 3.47VAHH22 pKa = 6.51QSSGFHH28 pKa = 6.85DD29 pKa = 3.82RR30 pKa = 11.84LFVAGVRR37 pKa = 11.84MWNHH41 pKa = 5.67EE42 pKa = 4.17HH43 pKa = 6.86TSMQRR48 pKa = 11.84ALRR51 pKa = 11.84RR52 pKa = 11.84LHH54 pKa = 6.2LASSRR59 pKa = 11.84VINFSVFLLLGSGAGTLLMM78 pKa = 5.42
MM1 pKa = 6.95AHH3 pKa = 6.53ARR5 pKa = 11.84ISTSTRR11 pKa = 11.84PTFSRR16 pKa = 11.84SLDD19 pKa = 3.47VAHH22 pKa = 6.51QSSGFHH28 pKa = 6.85DD29 pKa = 3.82RR30 pKa = 11.84LFVAGVRR37 pKa = 11.84MWNHH41 pKa = 5.67EE42 pKa = 4.17HH43 pKa = 6.86TSMQRR48 pKa = 11.84ALRR51 pKa = 11.84RR52 pKa = 11.84LHH54 pKa = 6.2LASSRR59 pKa = 11.84VINFSVFLLLGSGAGTLLMM78 pKa = 5.42
Molecular weight: 8.73 kDa
Isoelectric point according different methods:
Peptides (in silico digests for buttom-up proteomics)
Below you can find in silico digests of the whole proteome with Trypsin, Chymotrypsin, Trypsin+LysC, LysN, ArgC proteases suitable for different mass spec machines.| Try ESI |
 |
|---|
| ChTry ESI |
|
|---|
| ArgC ESI |
|
|---|
| LysN ESI |
|
|---|
| TryLysC ESI |
|
|---|
| Try MALDI |
|
|---|
| ChTry MALDI |
|
|---|
| ArgC MALDI |
|
|---|
| LysN MALDI |
|
|---|
| TryLysC MALDI |
|
|---|
| Try LTQ |
|
|---|
| ChTry LTQ |
|
|---|
| ArgC LTQ |
|
|---|
| LysN LTQ |
|
|---|
| TryLysC LTQ |
|
|---|
| Try MSlow |
|
|---|
| ChTry MSlow |
|
|---|
| ArgC MSlow |
|
|---|
| LysN MSlow |
|
|---|
| TryLysC MSlow |
|
|---|
| Try MShigh |
|
|---|
| ChTry MShigh |
|
|---|
| ArgC MShigh |
|
|---|
| LysN MShigh |
|
|---|
| TryLysC MShigh |
|
|---|
General Statistics
Number of major isoforms |
Number of additional isoforms |
Number of all proteins |
Number of amino acids |
Min. Seq. Length |
Max. Seq. Length |
Avg. Seq. Length |
Avg. Mol. Weight |
|---|---|---|---|---|---|---|---|
0 |
3542 |
42 |
711 |
253.0 |
27.66 |
Amino acid frequency
Ala |
Cys |
Asp |
Glu |
Phe |
Gly |
His |
Ile |
Lys |
Leu |
|---|---|---|---|---|---|---|---|---|---|
10.277 ± 0.677 | 0.903 ± 0.208 |
6.126 ± 0.434 | 5.336 ± 0.39 |
4.178 ± 0.301 | 7.51 ± 0.556 |
1.722 ± 0.425 | 5.167 ± 0.478 |
5.195 ± 0.315 | 8.498 ± 0.274 |
Met |
Asn |
Gln |
Pro |
Arg |
Ser |
Thr |
Val |
Trp |
Tyr |
|---|---|---|---|---|---|---|---|---|---|
3.331 ± 0.265 | 3.727 ± 0.374 |
3.981 ± 0.364 | 3.586 ± 0.311 |
5.082 ± 0.304 | 6.889 ± 0.539 |
6.494 ± 0.509 | 8.187 ± 0.382 |
1.101 ± 0.248 | 2.71 ± 0.323 |
Most of the basic statistics you can see at this page can be downloaded from this CSV file
See this proteome in:

Proteome-pI is available under Creative Commons Attribution-NoDerivs license, for more details see here
| Reference: Kozlowski LP. Proteome-pI 2.0: Proteome Isoelectric Point Database Update. Nucleic Acids Res. 2021, doi: 10.1093/nar/gkab944 | Contact: Lukasz P. Kozlowski |