Streptococcus satellite phage Javan743
Taxonomy: Viruses; unclassified bacterial viruses
Average proteome isoelectric point is 6.72
Get precalculated fractions of proteins
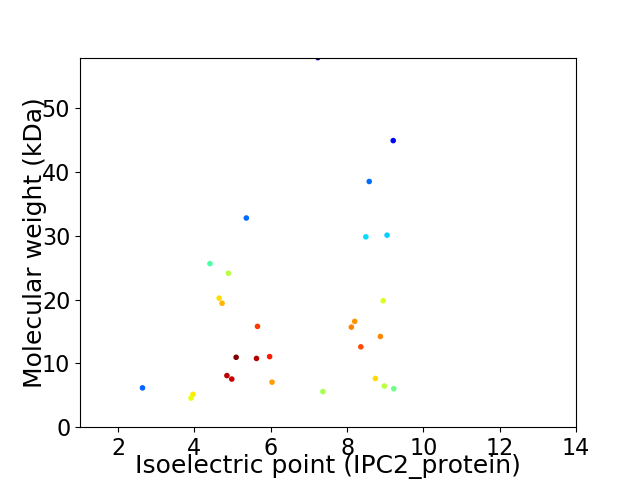
Virtual 2D-PAGE plot for 29 proteins (isoelectric point calculated using IPC2_protein)
Get csv file with sequences according to given criteria:
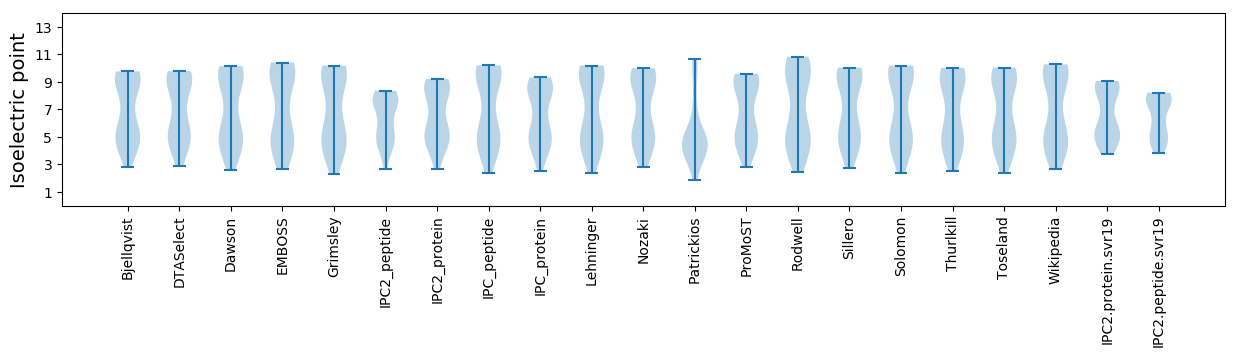
* You can choose from 21 different methods for calculating isoelectric point
Summary statistics related to proteome-wise predictions
Protein with the lowest isoelectric point:
>tr|A0A4D5ZZZ2|A0A4D5ZZZ2_9VIRU Uncharacterized protein OS=Streptococcus satellite phage Javan743 OX=2558837 GN=JavanS743_0024 PE=4 SV=1
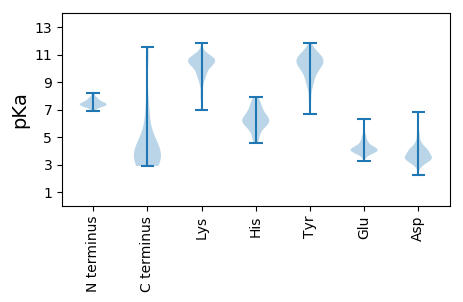
MM1 pKa = 7.87EE2 pKa = 4.51EE3 pKa = 3.56TTYY6 pKa = 11.03DD7 pKa = 3.82IIAKK11 pKa = 9.74SLDD14 pKa = 4.0RR15 pKa = 11.84ISMEE19 pKa = 3.74LHH21 pKa = 5.91QADD24 pKa = 4.33EE25 pKa = 4.59NNDD28 pKa = 3.14FLEE31 pKa = 4.3YY32 pKa = 10.95GFYY35 pKa = 10.31QDD37 pKa = 3.87NN38 pKa = 3.58
MM1 pKa = 7.87EE2 pKa = 4.51EE3 pKa = 3.56TTYY6 pKa = 11.03DD7 pKa = 3.82IIAKK11 pKa = 9.74SLDD14 pKa = 4.0RR15 pKa = 11.84ISMEE19 pKa = 3.74LHH21 pKa = 5.91QADD24 pKa = 4.33EE25 pKa = 4.59NNDD28 pKa = 3.14FLEE31 pKa = 4.3YY32 pKa = 10.95GFYY35 pKa = 10.31QDD37 pKa = 3.87NN38 pKa = 3.58
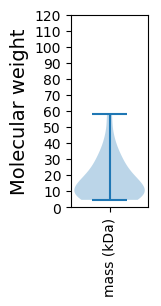
Molecular weight: 4.56 kDa
Isoelectric point according different methods:
Protein with the highest isoelectric point:
>tr|A0A4D5ZV45|A0A4D5ZV45_9VIRU Uncharacterized protein OS=Streptococcus satellite phage Javan743 OX=2558837 GN=JavanS743_0017 PE=4 SV=1
MM1 pKa = 7.37TNYY4 pKa = 10.27DD5 pKa = 3.45RR6 pKa = 11.84AKK8 pKa = 10.18RR9 pKa = 11.84FYY11 pKa = 11.3SRR13 pKa = 11.84ATYY16 pKa = 10.2VLSDD20 pKa = 3.99FLHH23 pKa = 6.11GRR25 pKa = 11.84IDD27 pKa = 3.42EE28 pKa = 4.27QEE30 pKa = 4.16FRR32 pKa = 11.84KK33 pKa = 9.32QWQRR37 pKa = 11.84LADD40 pKa = 3.58KK41 pKa = 10.66AVNEE45 pKa = 4.4TKK47 pKa = 10.79KK48 pKa = 10.85NN49 pKa = 3.51
MM1 pKa = 7.37TNYY4 pKa = 10.27DD5 pKa = 3.45RR6 pKa = 11.84AKK8 pKa = 10.18RR9 pKa = 11.84FYY11 pKa = 11.3SRR13 pKa = 11.84ATYY16 pKa = 10.2VLSDD20 pKa = 3.99FLHH23 pKa = 6.11GRR25 pKa = 11.84IDD27 pKa = 3.42EE28 pKa = 4.27QEE30 pKa = 4.16FRR32 pKa = 11.84KK33 pKa = 9.32QWQRR37 pKa = 11.84LADD40 pKa = 3.58KK41 pKa = 10.66AVNEE45 pKa = 4.4TKK47 pKa = 10.79KK48 pKa = 10.85NN49 pKa = 3.51
Molecular weight: 6.03 kDa
Isoelectric point according different methods:
Peptides (in silico digests for buttom-up proteomics)
Below you can find in silico digests of the whole proteome with Trypsin, Chymotrypsin, Trypsin+LysC, LysN, ArgC proteases suitable for different mass spec machines.| Try ESI |
 |
|---|
| ChTry ESI |
|
|---|
| ArgC ESI |
|
|---|
| LysN ESI |
|
|---|
| TryLysC ESI |
|
|---|
| Try MALDI |
|
|---|
| ChTry MALDI |
|
|---|
| ArgC MALDI |
|
|---|
| LysN MALDI |
|
|---|
| TryLysC MALDI |
|
|---|
| Try LTQ |
|
|---|
| ChTry LTQ |
|
|---|
| ArgC LTQ |
|
|---|
| LysN LTQ |
|
|---|
| TryLysC LTQ |
|
|---|
| Try MSlow |
|
|---|
| ChTry MSlow |
|
|---|
| ArgC MSlow |
|
|---|
| LysN MSlow |
|
|---|
| TryLysC MSlow |
|
|---|
| Try MShigh |
|
|---|
| ChTry MShigh |
|
|---|
| ArgC MShigh |
|
|---|
| LysN MShigh |
|
|---|
| TryLysC MShigh |
|
|---|
General Statistics
Number of major isoforms |
Number of additional isoforms |
Number of all proteins |
Number of amino acids |
Min. Seq. Length |
Max. Seq. Length |
Avg. Seq. Length |
Avg. Mol. Weight |
|---|---|---|---|---|---|---|---|
0 |
4434 |
38 |
496 |
152.9 |
17.76 |
Amino acid frequency
Ala |
Cys |
Asp |
Glu |
Phe |
Gly |
His |
Ile |
Lys |
Leu |
|---|---|---|---|---|---|---|---|---|---|
5.074 ± 0.295 | 0.699 ± 0.153 |
6.089 ± 0.329 | 8.683 ± 0.532 |
4.42 ± 0.289 | 5.074 ± 0.389 |
1.511 ± 0.181 | 6.969 ± 0.394 |
8.931 ± 0.495 | 9.968 ± 0.424 |
Met |
Asn |
Gln |
Pro |
Arg |
Ser |
Thr |
Val |
Trp |
Tyr |
|---|---|---|---|---|---|---|---|---|---|
2.797 ± 0.276 | 5.39 ± 0.41 |
2.616 ± 0.3 | 4.06 ± 0.291 |
5.774 ± 0.37 | 5.616 ± 0.349 |
5.909 ± 0.574 | 5.097 ± 0.335 |
0.88 ± 0.194 | 4.443 ± 0.275 |
Most of the basic statistics you can see at this page can be downloaded from this CSV file
See this proteome in:

Proteome-pI is available under Creative Commons Attribution-NoDerivs license, for more details see here
| Reference: Kozlowski LP. Proteome-pI 2.0: Proteome Isoelectric Point Database Update. Nucleic Acids Res. 2021, doi: 10.1093/nar/gkab944 | Contact: Lukasz P. Kozlowski |