Shigella phage Sf11 SMD-2017
Taxonomy: Viruses; Duplodnaviria; Heunggongvirae; Uroviricota; Caudoviricetes; Caudovirales; Siphoviridae; unclassified Siphoviridae
Average proteome isoelectric point is 6.54
Get precalculated fractions of proteins
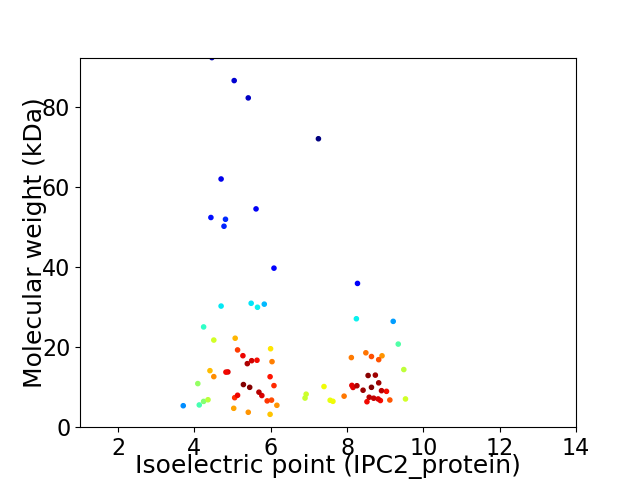
Virtual 2D-PAGE plot for 80 proteins (isoelectric point calculated using IPC2_protein)
Get csv file with sequences according to given criteria:
* You can choose from 21 different methods for calculating isoelectric point
Summary statistics related to proteome-wise predictions


Protein with the lowest isoelectric point:
>tr|A0A291AXD9|A0A291AXD9_9CAUD Uncharacterized protein OS=Shigella phage Sf11 SMD-2017 OX=2282196 GN=Sf11_gp27 PE=4 SV=1
MM1 pKa = 7.84IPLLWILSAYY11 pKa = 10.12AFARR15 pKa = 11.84VFEE18 pKa = 4.94ADD20 pKa = 3.03TLYY23 pKa = 11.42QMICYY28 pKa = 10.01GAMFCLSGAALAFMDD43 pKa = 5.54DD44 pKa = 4.37VISDD48 pKa = 3.56
MM1 pKa = 7.84IPLLWILSAYY11 pKa = 10.12AFARR15 pKa = 11.84VFEE18 pKa = 4.94ADD20 pKa = 3.03TLYY23 pKa = 11.42QMICYY28 pKa = 10.01GAMFCLSGAALAFMDD43 pKa = 5.54DD44 pKa = 4.37VISDD48 pKa = 3.56
Molecular weight: 5.36 kDa
Isoelectric point according different methods:
Protein with the highest isoelectric point:
>tr|A0A291AXJ6|A0A291AXJ6_9CAUD DNA-binding domain-containing protein OS=Shigella phage Sf11 SMD-2017 OX=2282196 GN=Sf11_gp71 PE=4 SV=1
MM1 pKa = 7.8AKK3 pKa = 9.86TIYY6 pKa = 9.96RR7 pKa = 11.84RR8 pKa = 11.84EE9 pKa = 4.01KK10 pKa = 10.21LEE12 pKa = 3.76QEE14 pKa = 4.24LGHH17 pKa = 7.05VGAQNFMSKK26 pKa = 7.49QARR29 pKa = 11.84NAMEE33 pKa = 4.66SIRR36 pKa = 11.84VNRR39 pKa = 11.84VVRR42 pKa = 11.84VFNGEE47 pKa = 3.69GKK49 pKa = 10.08RR50 pKa = 11.84RR51 pKa = 11.84VMDD54 pKa = 3.54EE55 pKa = 4.36LIIVFF60 pKa = 4.5
MM1 pKa = 7.8AKK3 pKa = 9.86TIYY6 pKa = 9.96RR7 pKa = 11.84RR8 pKa = 11.84EE9 pKa = 4.01KK10 pKa = 10.21LEE12 pKa = 3.76QEE14 pKa = 4.24LGHH17 pKa = 7.05VGAQNFMSKK26 pKa = 7.49QARR29 pKa = 11.84NAMEE33 pKa = 4.66SIRR36 pKa = 11.84VNRR39 pKa = 11.84VVRR42 pKa = 11.84VFNGEE47 pKa = 3.69GKK49 pKa = 10.08RR50 pKa = 11.84RR51 pKa = 11.84VMDD54 pKa = 3.54EE55 pKa = 4.36LIIVFF60 pKa = 4.5
Molecular weight: 7.05 kDa
Isoelectric point according different methods:
Peptides (in silico digests for buttom-up proteomics)
Below you can find in silico digests of the whole proteome with Trypsin, Chymotrypsin, Trypsin+LysC, LysN, ArgC proteases suitable for different mass spec machines.| Try ESI |
 |
|---|
| ChTry ESI |
|
|---|
| ArgC ESI |
|
|---|
| LysN ESI |
|
|---|
| TryLysC ESI |
|
|---|
| Try MALDI |
|
|---|
| ChTry MALDI |
|
|---|
| ArgC MALDI |
|
|---|
| LysN MALDI |
|
|---|
| TryLysC MALDI |
|
|---|
| Try LTQ |
|
|---|
| ChTry LTQ |
|
|---|
| ArgC LTQ |
|
|---|
| LysN LTQ |
|
|---|
| TryLysC LTQ |
|
|---|
| Try MSlow |
|
|---|
| ChTry MSlow |
|
|---|
| ArgC MSlow |
|
|---|
| LysN MSlow |
|
|---|
| TryLysC MSlow |
|
|---|
| Try MShigh |
|
|---|
| ChTry MShigh |
|
|---|
| ArgC MShigh |
|
|---|
| LysN MShigh |
|
|---|
| TryLysC MShigh |
|
|---|
General Statistics
Number of major isoforms |
Number of additional isoforms |
Number of all proteins |
Number of amino acids |
Min. Seq. Length |
Max. Seq. Length |
Avg. Seq. Length |
Avg. Mol. Weight |
|---|---|---|---|---|---|---|---|
0 |
14002 |
31 |
828 |
175.0 |
19.55 |
Amino acid frequency
Ala |
Cys |
Asp |
Glu |
Phe |
Gly |
His |
Ile |
Lys |
Leu |
|---|---|---|---|---|---|---|---|---|---|
8.549 ± 0.603 | 1.343 ± 0.164 |
6.042 ± 0.218 | 6.635 ± 0.344 |
3.485 ± 0.196 | 7.149 ± 0.273 |
1.6 ± 0.169 | 6.835 ± 0.213 |
6.271 ± 0.334 | 6.999 ± 0.184 |
Met |
Asn |
Gln |
Pro |
Arg |
Ser |
Thr |
Val |
Trp |
Tyr |
|---|---|---|---|---|---|---|---|---|---|
3.207 ± 0.205 | 4.949 ± 0.27 |
3.442 ± 0.207 | 3.649 ± 0.294 |
5.114 ± 0.258 | 6.585 ± 0.273 |
5.621 ± 0.393 | 7.092 ± 0.298 |
1.621 ± 0.114 | 3.814 ± 0.246 |
Most of the basic statistics you can see at this page can be downloaded from this CSV file
See this proteome in:

Proteome-pI is available under Creative Commons Attribution-NoDerivs license, for more details see here
| Reference: Kozlowski LP. Proteome-pI 2.0: Proteome Isoelectric Point Database Update. Nucleic Acids Res. 2021, doi: 10.1093/nar/gkab944 | Contact: Lukasz P. Kozlowski |