Bacillus phage Novomoskovsk
Taxonomy: Viruses; Duplodnaviria; Heunggongvirae; Uroviricota; Caudoviricetes; Caudovirales; Siphoviridae; Andromedavirus; unclassified Andromedavirus
Average proteome isoelectric point is 6.17
Get precalculated fractions of proteins
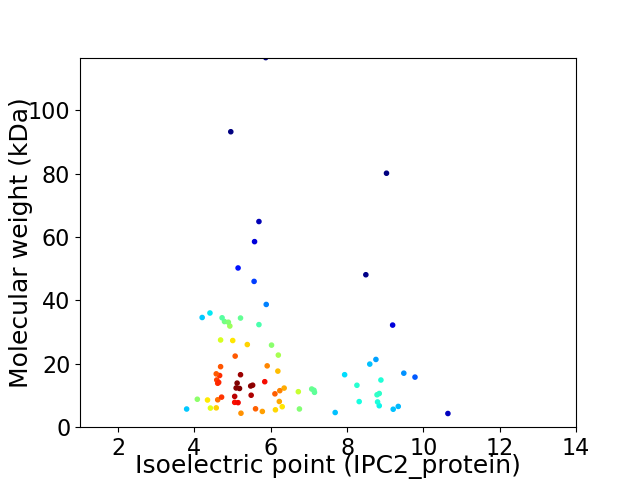
Virtual 2D-PAGE plot for 80 proteins (isoelectric point calculated using IPC2_protein)
Get csv file with sequences according to given criteria:
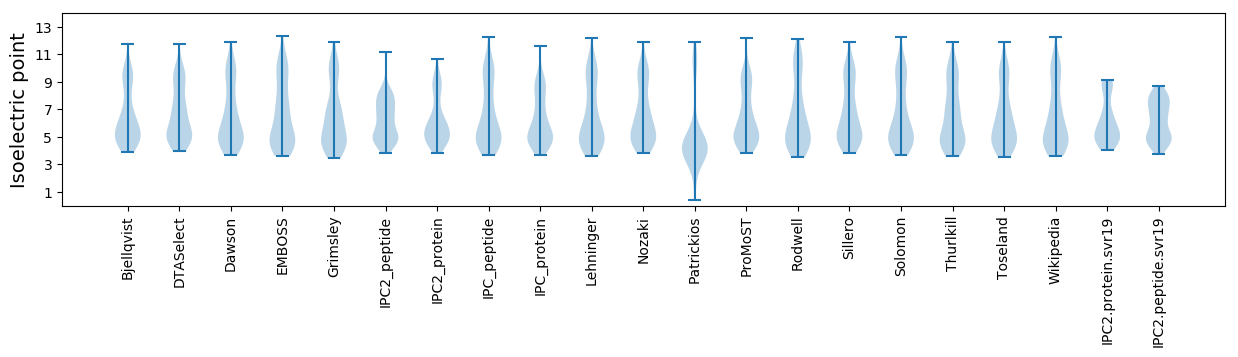
* You can choose from 21 different methods for calculating isoelectric point
Summary statistics related to proteome-wise predictions
Protein with the lowest isoelectric point:
>tr|A0A6M9Z8U5|A0A6M9Z8U5_9CAUD Uncharacterized protein OS=Bacillus phage Novomoskovsk OX=2736258 GN=Novomoskovsk_6 PE=4 SV=1
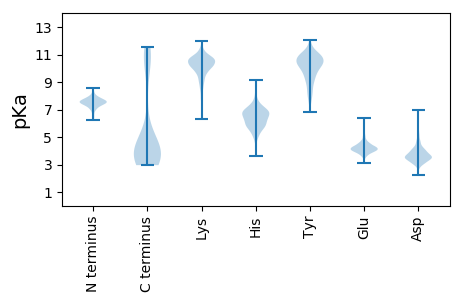
MM1 pKa = 7.62SILKK5 pKa = 8.23EE6 pKa = 3.94FCDD9 pKa = 3.53KK10 pKa = 10.74VRR12 pKa = 11.84EE13 pKa = 4.13LEE15 pKa = 4.1EE16 pKa = 4.3EE17 pKa = 4.16YY18 pKa = 11.06GVYY21 pKa = 10.62LDD23 pKa = 4.69VDD25 pKa = 4.19PDD27 pKa = 3.63QIIIVAVNNEE37 pKa = 4.15DD38 pKa = 3.55GQEE41 pKa = 3.38RR42 pKa = 11.84WIYY45 pKa = 11.02DD46 pKa = 3.49DD47 pKa = 3.76EE48 pKa = 4.45
MM1 pKa = 7.62SILKK5 pKa = 8.23EE6 pKa = 3.94FCDD9 pKa = 3.53KK10 pKa = 10.74VRR12 pKa = 11.84EE13 pKa = 4.13LEE15 pKa = 4.1EE16 pKa = 4.3EE17 pKa = 4.16YY18 pKa = 11.06GVYY21 pKa = 10.62LDD23 pKa = 4.69VDD25 pKa = 4.19PDD27 pKa = 3.63QIIIVAVNNEE37 pKa = 4.15DD38 pKa = 3.55GQEE41 pKa = 3.38RR42 pKa = 11.84WIYY45 pKa = 11.02DD46 pKa = 3.49DD47 pKa = 3.76EE48 pKa = 4.45
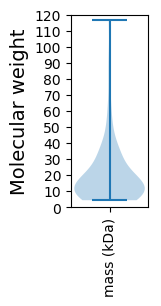
Molecular weight: 5.74 kDa
Isoelectric point according different methods:
Protein with the highest isoelectric point:
>tr|A0A6M9Z6C7|A0A6M9Z6C7_9CAUD FtsK/SpoIIIE-family protein OS=Bacillus phage Novomoskovsk OX=2736258 GN=Novomoskovsk_68 PE=4 SV=1
MM1 pKa = 7.45SLLKK5 pKa = 10.64SILKK9 pKa = 10.59SPTTKK14 pKa = 10.13KK15 pKa = 10.07VAIRR19 pKa = 11.84GIKK22 pKa = 9.87VGLPVLLRR30 pKa = 11.84YY31 pKa = 8.73AQKK34 pKa = 10.76KK35 pKa = 9.97RR36 pKa = 11.84GVKK39 pKa = 9.78
MM1 pKa = 7.45SLLKK5 pKa = 10.64SILKK9 pKa = 10.59SPTTKK14 pKa = 10.13KK15 pKa = 10.07VAIRR19 pKa = 11.84GIKK22 pKa = 9.87VGLPVLLRR30 pKa = 11.84YY31 pKa = 8.73AQKK34 pKa = 10.76KK35 pKa = 9.97RR36 pKa = 11.84GVKK39 pKa = 9.78
Molecular weight: 4.32 kDa
Isoelectric point according different methods:
Peptides (in silico digests for buttom-up proteomics)
Below you can find in silico digests of the whole proteome with Trypsin, Chymotrypsin, Trypsin+LysC, LysN, ArgC proteases suitable for different mass spec machines.| Try ESI |
 |
|---|
| ChTry ESI |
|
|---|
| ArgC ESI |
|
|---|
| LysN ESI |
|
|---|
| TryLysC ESI |
|
|---|
| Try MALDI |
|
|---|
| ChTry MALDI |
|
|---|
| ArgC MALDI |
|
|---|
| LysN MALDI |
|
|---|
| TryLysC MALDI |
|
|---|
| Try LTQ |
|
|---|
| ChTry LTQ |
|
|---|
| ArgC LTQ |
|
|---|
| LysN LTQ |
|
|---|
| TryLysC LTQ |
|
|---|
| Try MSlow |
|
|---|
| ChTry MSlow |
|
|---|
| ArgC MSlow |
|
|---|
| LysN MSlow |
|
|---|
| TryLysC MSlow |
|
|---|
| Try MShigh |
|
|---|
| ChTry MShigh |
|
|---|
| ArgC MShigh |
|
|---|
| LysN MShigh |
|
|---|
| TryLysC MShigh |
|
|---|
General Statistics
Number of major isoforms |
Number of additional isoforms |
Number of all proteins |
Number of amino acids |
Min. Seq. Length |
Max. Seq. Length |
Avg. Seq. Length |
Avg. Mol. Weight |
|---|---|---|---|---|---|---|---|
0 |
14738 |
38 |
1026 |
184.2 |
20.92 |
Amino acid frequency
Ala |
Cys |
Asp |
Glu |
Phe |
Gly |
His |
Ile |
Lys |
Leu |
|---|---|---|---|---|---|---|---|---|---|
6.202 ± 0.447 | 0.916 ± 0.142 |
6.208 ± 0.282 | 8.135 ± 0.488 |
4.607 ± 0.211 | 6.683 ± 0.345 |
2.124 ± 0.219 | 6.853 ± 0.201 |
8.115 ± 0.5 | 7.783 ± 0.407 |
Met |
Asn |
Gln |
Pro |
Arg |
Ser |
Thr |
Val |
Trp |
Tyr |
|---|---|---|---|---|---|---|---|---|---|
2.816 ± 0.183 | 4.865 ± 0.34 |
3.243 ± 0.149 | 3.474 ± 0.182 |
4.383 ± 0.239 | 6.256 ± 0.359 |
6.154 ± 0.427 | 6.1 ± 0.255 |
1.126 ± 0.108 | 3.956 ± 0.246 |
Most of the basic statistics you can see at this page can be downloaded from this CSV file
See this proteome in:

Proteome-pI is available under Creative Commons Attribution-NoDerivs license, for more details see here
| Reference: Kozlowski LP. Proteome-pI 2.0: Proteome Isoelectric Point Database Update. Nucleic Acids Res. 2021, doi: 10.1093/nar/gkab944 | Contact: Lukasz P. Kozlowski |