Endogone sp. FLAS-F59071
Taxonomy: cellular organisms; Eukaryota; Opisthokonta; Fungi; Fungi incertae sedis; Mucoromycota; Mucoromycotina; Endogonomycetes; Endogonales; Endogonaceae; Endogone; unclassified Endogone
Average proteome isoelectric point is 6.6
Get precalculated fractions of proteins
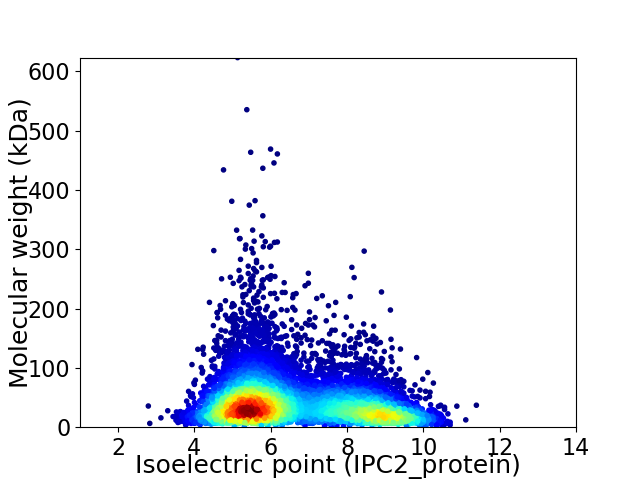
Virtual 2D-PAGE plot for 9431 proteins (isoelectric point calculated using IPC2_protein)
Get csv file with sequences according to given criteria:
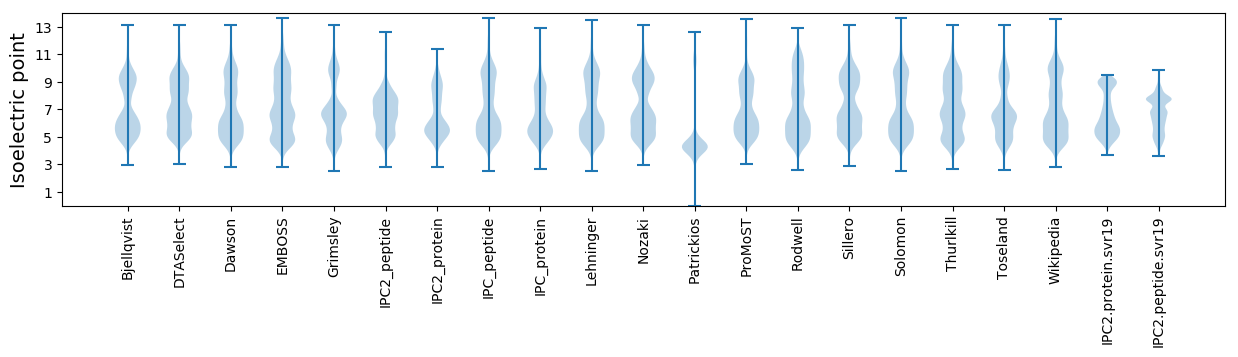
* You can choose from 21 different methods for calculating isoelectric point
Summary statistics related to proteome-wise predictions
Protein with the lowest isoelectric point:
>tr|A0A433PLB9|A0A433PLB9_9FUNG Uncharacterized protein OS=Endogone sp. FLAS-F59071 OX=2340872 GN=BC937DRAFT_89004 PE=4 SV=1
MM1 pKa = 7.33YY2 pKa = 10.28CPGMYY7 pKa = 9.97YY8 pKa = 10.33KK9 pKa = 10.68SSPLHH14 pKa = 6.78HH15 pKa = 6.77NLQPDD20 pKa = 3.6VGSASPSGINYY31 pKa = 10.08SAITTDD37 pKa = 3.02LHH39 pKa = 6.52FPAEE43 pKa = 4.33GLVSSIVPGGTVPEE57 pKa = 4.5GTVPEE62 pKa = 4.24DD63 pKa = 3.63TVPEE67 pKa = 4.32GTVPEE72 pKa = 4.3DD73 pKa = 3.6TVPEE77 pKa = 4.13DD78 pKa = 3.81TVPEE82 pKa = 4.19DD83 pKa = 3.64TVPEE87 pKa = 4.16YY88 pKa = 9.92TVPEE92 pKa = 4.16DD93 pKa = 3.58TVPEE97 pKa = 4.15VLEE100 pKa = 4.29GTVPEE105 pKa = 4.41VPEE108 pKa = 4.07DD109 pKa = 3.87TVPEE113 pKa = 4.1DD114 pKa = 3.92TVPVDD119 pKa = 4.23ALAADD124 pKa = 3.83TALACSTAPADD135 pKa = 3.85TDD137 pKa = 3.9PAADD141 pKa = 3.8SAPADD146 pKa = 3.79TAPVGDD152 pKa = 4.11TAWANPATGMPRR164 pKa = 11.84KK165 pKa = 10.16VKK167 pKa = 10.04VRR169 pKa = 11.84CSQSARR175 pKa = 11.84GGCWRR180 pKa = 11.84QAA182 pKa = 3.07
MM1 pKa = 7.33YY2 pKa = 10.28CPGMYY7 pKa = 9.97YY8 pKa = 10.33KK9 pKa = 10.68SSPLHH14 pKa = 6.78HH15 pKa = 6.77NLQPDD20 pKa = 3.6VGSASPSGINYY31 pKa = 10.08SAITTDD37 pKa = 3.02LHH39 pKa = 6.52FPAEE43 pKa = 4.33GLVSSIVPGGTVPEE57 pKa = 4.5GTVPEE62 pKa = 4.24DD63 pKa = 3.63TVPEE67 pKa = 4.32GTVPEE72 pKa = 4.3DD73 pKa = 3.6TVPEE77 pKa = 4.13DD78 pKa = 3.81TVPEE82 pKa = 4.19DD83 pKa = 3.64TVPEE87 pKa = 4.16YY88 pKa = 9.92TVPEE92 pKa = 4.16DD93 pKa = 3.58TVPEE97 pKa = 4.15VLEE100 pKa = 4.29GTVPEE105 pKa = 4.41VPEE108 pKa = 4.07DD109 pKa = 3.87TVPEE113 pKa = 4.1DD114 pKa = 3.92TVPVDD119 pKa = 4.23ALAADD124 pKa = 3.83TALACSTAPADD135 pKa = 3.85TDD137 pKa = 3.9PAADD141 pKa = 3.8SAPADD146 pKa = 3.79TAPVGDD152 pKa = 4.11TAWANPATGMPRR164 pKa = 11.84KK165 pKa = 10.16VKK167 pKa = 10.04VRR169 pKa = 11.84CSQSARR175 pKa = 11.84GGCWRR180 pKa = 11.84QAA182 pKa = 3.07
Molecular weight: 18.83 kDa
Isoelectric point according different methods:
Protein with the highest isoelectric point:
>tr|A0A433PTP4|A0A433PTP4_9FUNG Uncharacterized protein OS=Endogone sp. FLAS-F59071 OX=2340872 GN=BC937DRAFT_94075 PE=4 SV=1
MM1 pKa = 7.43KK2 pKa = 10.41LVRR5 pKa = 11.84LTKK8 pKa = 10.66LLVRR12 pKa = 11.84STKK15 pKa = 10.75LLVKK19 pKa = 10.81SMMKK23 pKa = 10.49LVRR26 pKa = 11.84LMTKK30 pKa = 10.53LLVKK34 pKa = 10.86SMTKK38 pKa = 10.49LVRR41 pKa = 11.84STTLVRR47 pKa = 11.84LTKK50 pKa = 10.56LLLVRR55 pKa = 11.84STKK58 pKa = 10.74LLVRR62 pKa = 11.84STTTKK67 pKa = 10.43LVRR70 pKa = 11.84SMKK73 pKa = 10.14LVRR76 pKa = 11.84STKK79 pKa = 10.31LLVRR83 pKa = 11.84STTKK87 pKa = 10.79LLVRR91 pKa = 11.84STTKK95 pKa = 10.52LVRR98 pKa = 11.84STKK101 pKa = 10.04LVRR104 pKa = 11.84STKK107 pKa = 10.42LLVRR111 pKa = 11.84STTKK115 pKa = 10.75LVTTKK120 pKa = 10.54LVRR123 pKa = 11.84STTTKK128 pKa = 10.51LVRR131 pKa = 11.84STKK134 pKa = 10.04LVRR137 pKa = 11.84STKK140 pKa = 10.44LLVRR144 pKa = 11.84SMTKK148 pKa = 10.48LLVRR152 pKa = 11.84SMATKK157 pKa = 10.64LVRR160 pKa = 11.84STKK163 pKa = 10.29LLVRR167 pKa = 11.84STMTKK172 pKa = 10.28LVRR175 pKa = 11.84STKK178 pKa = 10.42LLVRR182 pKa = 11.84STTKK186 pKa = 10.79LLVRR190 pKa = 11.84STTTKK195 pKa = 10.51LVRR198 pKa = 11.84STKK201 pKa = 10.01LVRR204 pKa = 11.84SMKK207 pKa = 10.09LVRR210 pKa = 11.84SMTKK214 pKa = 10.3LLVRR218 pKa = 11.84STATKK223 pKa = 10.38LVRR226 pKa = 11.84STKK229 pKa = 10.04LVRR232 pKa = 11.84STKK235 pKa = 10.42LLVRR239 pKa = 11.84STTKK243 pKa = 10.83LVTTKK248 pKa = 10.85LLVRR252 pKa = 11.84STTTKK257 pKa = 10.81LMRR260 pKa = 11.84STKK263 pKa = 9.97LVRR266 pKa = 11.84STKK269 pKa = 10.58LLVRR273 pKa = 11.84STKK276 pKa = 10.55LVTTKK281 pKa = 10.83LVTTKK286 pKa = 10.63LVRR289 pKa = 11.84STKK292 pKa = 10.46LLLRR296 pKa = 11.84STTTKK301 pKa = 10.55LVRR304 pKa = 11.84STKK307 pKa = 10.07LVRR310 pKa = 11.84LTKK313 pKa = 10.56LLVRR317 pKa = 11.84SRR319 pKa = 11.84LEE321 pKa = 4.23FTCHH325 pKa = 5.89
MM1 pKa = 7.43KK2 pKa = 10.41LVRR5 pKa = 11.84LTKK8 pKa = 10.66LLVRR12 pKa = 11.84STKK15 pKa = 10.75LLVKK19 pKa = 10.81SMMKK23 pKa = 10.49LVRR26 pKa = 11.84LMTKK30 pKa = 10.53LLVKK34 pKa = 10.86SMTKK38 pKa = 10.49LVRR41 pKa = 11.84STTLVRR47 pKa = 11.84LTKK50 pKa = 10.56LLLVRR55 pKa = 11.84STKK58 pKa = 10.74LLVRR62 pKa = 11.84STTTKK67 pKa = 10.43LVRR70 pKa = 11.84SMKK73 pKa = 10.14LVRR76 pKa = 11.84STKK79 pKa = 10.31LLVRR83 pKa = 11.84STTKK87 pKa = 10.79LLVRR91 pKa = 11.84STTKK95 pKa = 10.52LVRR98 pKa = 11.84STKK101 pKa = 10.04LVRR104 pKa = 11.84STKK107 pKa = 10.42LLVRR111 pKa = 11.84STTKK115 pKa = 10.75LVTTKK120 pKa = 10.54LVRR123 pKa = 11.84STTTKK128 pKa = 10.51LVRR131 pKa = 11.84STKK134 pKa = 10.04LVRR137 pKa = 11.84STKK140 pKa = 10.44LLVRR144 pKa = 11.84SMTKK148 pKa = 10.48LLVRR152 pKa = 11.84SMATKK157 pKa = 10.64LVRR160 pKa = 11.84STKK163 pKa = 10.29LLVRR167 pKa = 11.84STMTKK172 pKa = 10.28LVRR175 pKa = 11.84STKK178 pKa = 10.42LLVRR182 pKa = 11.84STTKK186 pKa = 10.79LLVRR190 pKa = 11.84STTTKK195 pKa = 10.51LVRR198 pKa = 11.84STKK201 pKa = 10.01LVRR204 pKa = 11.84SMKK207 pKa = 10.09LVRR210 pKa = 11.84SMTKK214 pKa = 10.3LLVRR218 pKa = 11.84STATKK223 pKa = 10.38LVRR226 pKa = 11.84STKK229 pKa = 10.04LVRR232 pKa = 11.84STKK235 pKa = 10.42LLVRR239 pKa = 11.84STTKK243 pKa = 10.83LVTTKK248 pKa = 10.85LLVRR252 pKa = 11.84STTTKK257 pKa = 10.81LMRR260 pKa = 11.84STKK263 pKa = 9.97LVRR266 pKa = 11.84STKK269 pKa = 10.58LLVRR273 pKa = 11.84STKK276 pKa = 10.55LVTTKK281 pKa = 10.83LVTTKK286 pKa = 10.63LVRR289 pKa = 11.84STKK292 pKa = 10.46LLLRR296 pKa = 11.84STTTKK301 pKa = 10.55LVRR304 pKa = 11.84STKK307 pKa = 10.07LVRR310 pKa = 11.84LTKK313 pKa = 10.56LLVRR317 pKa = 11.84SRR319 pKa = 11.84LEE321 pKa = 4.23FTCHH325 pKa = 5.89
Molecular weight: 37.07 kDa
Isoelectric point according different methods:
Peptides (in silico digests for buttom-up proteomics)
Below you can find in silico digests of the whole proteome with Trypsin, Chymotrypsin, Trypsin+LysC, LysN, ArgC proteases suitable for different mass spec machines.| Try ESI |
 |
|---|
| ChTry ESI |
|
|---|
| ArgC ESI |
|
|---|
| LysN ESI |
|
|---|
| TryLysC ESI |
|
|---|
| Try MALDI |
|
|---|
| ChTry MALDI |
|
|---|
| ArgC MALDI |
|
|---|
| LysN MALDI |
|
|---|
| TryLysC MALDI |
|
|---|
| Try LTQ |
|
|---|
| ChTry LTQ |
|
|---|
| ArgC LTQ |
|
|---|
| LysN LTQ |
|
|---|
| TryLysC LTQ |
|
|---|
| Try MSlow |
|
|---|
| ChTry MSlow |
|
|---|
| ArgC MSlow |
|
|---|
| LysN MSlow |
|
|---|
| TryLysC MSlow |
|
|---|
| Try MShigh |
|
|---|
| ChTry MShigh |
|
|---|
| ArgC MShigh |
|
|---|
| LysN MShigh |
|
|---|
| TryLysC MShigh |
|
|---|
General Statistics
Number of major isoforms |
Number of additional isoforms |
Number of all proteins |
Number of amino acids |
Min. Seq. Length |
Max. Seq. Length |
Avg. Seq. Length |
Avg. Mol. Weight |
|---|---|---|---|---|---|---|---|
3895637 |
8 |
5502 |
413.1 |
46.02 |
Amino acid frequency
Ala |
Cys |
Asp |
Glu |
Phe |
Gly |
His |
Ile |
Lys |
Leu |
|---|---|---|---|---|---|---|---|---|---|
7.835 ± 0.024 | 1.326 ± 0.011 |
5.576 ± 0.021 | 6.456 ± 0.032 |
3.894 ± 0.017 | 6.117 ± 0.023 |
2.459 ± 0.011 | 5.257 ± 0.018 |
5.087 ± 0.023 | 9.139 ± 0.029 |
Met |
Asn |
Gln |
Pro |
Arg |
Ser |
Thr |
Val |
Trp |
Tyr |
|---|---|---|---|---|---|---|---|---|---|
2.213 ± 0.011 | 4.017 ± 0.016 |
5.785 ± 0.029 | 3.945 ± 0.023 |
6.01 ± 0.021 | 8.067 ± 0.03 |
6.211 ± 0.021 | 6.498 ± 0.02 |
1.235 ± 0.008 | 2.873 ± 0.014 |
Most of the basic statistics you can see at this page can be downloaded from this CSV file
See this proteome in:

Proteome-pI is available under Creative Commons Attribution-NoDerivs license, for more details see here
| Reference: Kozlowski LP. Proteome-pI 2.0: Proteome Isoelectric Point Database Update. Nucleic Acids Res. 2021, doi: 10.1093/nar/gkab944 | Contact: Lukasz P. Kozlowski |