Thermobifida fusca (strain YX)
Taxonomy: cellular organisms; Bacteria; Terrabacteria group; Actinobacteria; Actinomycetia; Streptosporangiales; Nocardiopsaceae; Thermobifida; Thermobifida fusca
Average proteome isoelectric point is 6.29
Get precalculated fractions of proteins
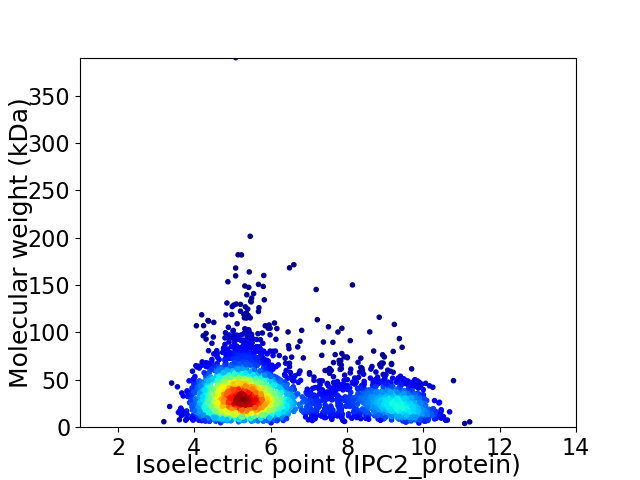
Virtual 2D-PAGE plot for 3085 proteins (isoelectric point calculated using IPC2_protein)
Get csv file with sequences according to given criteria:
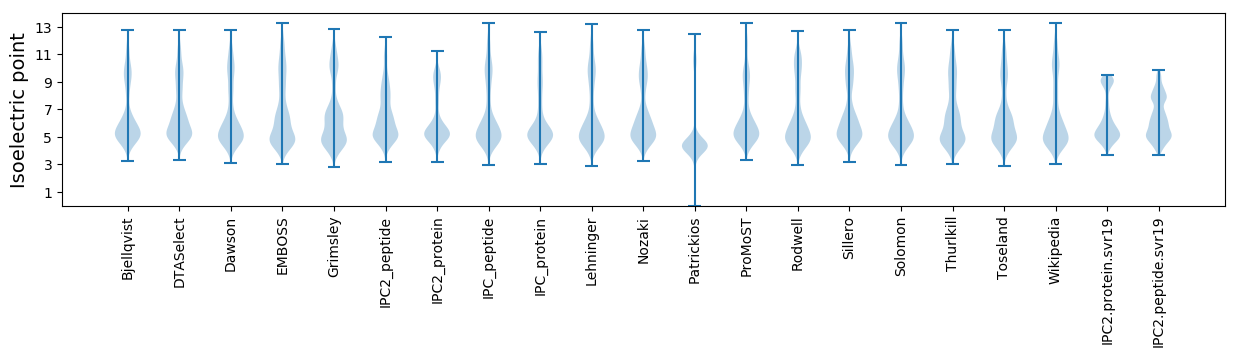
* You can choose from 21 different methods for calculating isoelectric point
Summary statistics related to proteome-wise predictions
Protein with the lowest isoelectric point:
>tr|Q47LA5|Q47LA5_THEFY Redox-sensing transcriptional repressor Rex OS=Thermobifida fusca (strain YX) OX=269800 GN=rex PE=3 SV=1
MM1 pKa = 7.59KK2 pKa = 10.35LIRR5 pKa = 11.84YY6 pKa = 7.58GKK8 pKa = 9.43IAGVTLASALALSACGSDD26 pKa = 3.27QAVAPEE32 pKa = 4.3EE33 pKa = 4.33TGGTAAGSVDD43 pKa = 3.92CVQGGGTLAGAGASSQEE60 pKa = 3.92KK61 pKa = 10.7AMAAWVAAYY70 pKa = 8.57TSACADD76 pKa = 3.34TTVNYY81 pKa = 10.7DD82 pKa = 3.4SVGSGAGRR90 pKa = 11.84SQFIEE95 pKa = 4.34GAVSFAGSDD104 pKa = 3.31SPMDD108 pKa = 3.74EE109 pKa = 4.7EE110 pKa = 4.37EE111 pKa = 4.12TAQATEE117 pKa = 3.93RR118 pKa = 11.84CGGSEE123 pKa = 4.0AVHH126 pKa = 6.15LPAYY130 pKa = 9.26ISPIAIIFNLEE141 pKa = 4.02GVDD144 pKa = 3.87SLNLRR149 pKa = 11.84PEE151 pKa = 4.24VIADD155 pKa = 3.81IFNQKK160 pKa = 6.67ITKK163 pKa = 9.23WNDD166 pKa = 2.63EE167 pKa = 4.76AIAADD172 pKa = 4.24NPDD175 pKa = 3.4VDD177 pKa = 5.8LPDD180 pKa = 5.2ADD182 pKa = 4.28IIPVNRR188 pKa = 11.84SDD190 pKa = 4.43EE191 pKa = 4.41SGTTEE196 pKa = 4.66NFVQYY201 pKa = 10.4LSEE204 pKa = 4.38AAPDD208 pKa = 3.54HH209 pKa = 6.52WPHH212 pKa = 6.05EE213 pKa = 4.53VSGDD217 pKa = 3.32WPIPPVEE224 pKa = 4.14AAQGSSGVVSAVQGGTGTIGYY245 pKa = 9.55VDD247 pKa = 4.12ASHH250 pKa = 6.2ATEE253 pKa = 4.59FGTVAVGVGDD263 pKa = 3.74SFVPYY268 pKa = 10.26SPEE271 pKa = 3.3AAAAIVDD278 pKa = 3.9SAEE281 pKa = 3.81PRR283 pKa = 11.84EE284 pKa = 4.38GNTEE288 pKa = 3.6NDD290 pKa = 3.48LAVSLNYY297 pKa = 9.47ATDD300 pKa = 3.37EE301 pKa = 4.66DD302 pKa = 4.48GVYY305 pKa = 10.51PIVLVSYY312 pKa = 9.38EE313 pKa = 4.32IVCLEE318 pKa = 4.53YY319 pKa = 10.73EE320 pKa = 4.5DD321 pKa = 3.69QTEE324 pKa = 3.98ADD326 pKa = 4.0LVKK329 pKa = 10.96SFIGYY334 pKa = 9.31VISEE338 pKa = 4.47EE339 pKa = 4.35GQQAAANEE347 pKa = 4.47AGSAPLSDD355 pKa = 3.34ATRR358 pKa = 11.84DD359 pKa = 3.58KK360 pKa = 10.99IQAVLDD366 pKa = 4.4KK367 pKa = 10.82IQVASS372 pKa = 3.64
MM1 pKa = 7.59KK2 pKa = 10.35LIRR5 pKa = 11.84YY6 pKa = 7.58GKK8 pKa = 9.43IAGVTLASALALSACGSDD26 pKa = 3.27QAVAPEE32 pKa = 4.3EE33 pKa = 4.33TGGTAAGSVDD43 pKa = 3.92CVQGGGTLAGAGASSQEE60 pKa = 3.92KK61 pKa = 10.7AMAAWVAAYY70 pKa = 8.57TSACADD76 pKa = 3.34TTVNYY81 pKa = 10.7DD82 pKa = 3.4SVGSGAGRR90 pKa = 11.84SQFIEE95 pKa = 4.34GAVSFAGSDD104 pKa = 3.31SPMDD108 pKa = 3.74EE109 pKa = 4.7EE110 pKa = 4.37EE111 pKa = 4.12TAQATEE117 pKa = 3.93RR118 pKa = 11.84CGGSEE123 pKa = 4.0AVHH126 pKa = 6.15LPAYY130 pKa = 9.26ISPIAIIFNLEE141 pKa = 4.02GVDD144 pKa = 3.87SLNLRR149 pKa = 11.84PEE151 pKa = 4.24VIADD155 pKa = 3.81IFNQKK160 pKa = 6.67ITKK163 pKa = 9.23WNDD166 pKa = 2.63EE167 pKa = 4.76AIAADD172 pKa = 4.24NPDD175 pKa = 3.4VDD177 pKa = 5.8LPDD180 pKa = 5.2ADD182 pKa = 4.28IIPVNRR188 pKa = 11.84SDD190 pKa = 4.43EE191 pKa = 4.41SGTTEE196 pKa = 4.66NFVQYY201 pKa = 10.4LSEE204 pKa = 4.38AAPDD208 pKa = 3.54HH209 pKa = 6.52WPHH212 pKa = 6.05EE213 pKa = 4.53VSGDD217 pKa = 3.32WPIPPVEE224 pKa = 4.14AAQGSSGVVSAVQGGTGTIGYY245 pKa = 9.55VDD247 pKa = 4.12ASHH250 pKa = 6.2ATEE253 pKa = 4.59FGTVAVGVGDD263 pKa = 3.74SFVPYY268 pKa = 10.26SPEE271 pKa = 3.3AAAAIVDD278 pKa = 3.9SAEE281 pKa = 3.81PRR283 pKa = 11.84EE284 pKa = 4.38GNTEE288 pKa = 3.6NDD290 pKa = 3.48LAVSLNYY297 pKa = 9.47ATDD300 pKa = 3.37EE301 pKa = 4.66DD302 pKa = 4.48GVYY305 pKa = 10.51PIVLVSYY312 pKa = 9.38EE313 pKa = 4.32IVCLEE318 pKa = 4.53YY319 pKa = 10.73EE320 pKa = 4.5DD321 pKa = 3.69QTEE324 pKa = 3.98ADD326 pKa = 4.0LVKK329 pKa = 10.96SFIGYY334 pKa = 9.31VISEE338 pKa = 4.47EE339 pKa = 4.35GQQAAANEE347 pKa = 4.47AGSAPLSDD355 pKa = 3.34ATRR358 pKa = 11.84DD359 pKa = 3.58KK360 pKa = 10.99IQAVLDD366 pKa = 4.4KK367 pKa = 10.82IQVASS372 pKa = 3.64
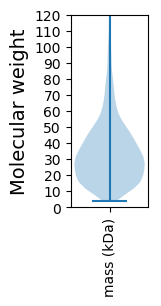
Molecular weight: 38.34 kDa
Isoelectric point according different methods:
Protein with the highest isoelectric point:
>sp|Q47LK0|RL16_THEFY 50S ribosomal protein L16 OS=Thermobifida fusca (strain YX) OX=269800 GN=rplP PE=3 SV=1
MM1 pKa = 7.28GSVVKK6 pKa = 10.49KK7 pKa = 9.45RR8 pKa = 11.84RR9 pKa = 11.84KK10 pKa = 9.48RR11 pKa = 11.84MAKK14 pKa = 9.41KK15 pKa = 9.99KK16 pKa = 9.77HH17 pKa = 5.81RR18 pKa = 11.84KK19 pKa = 8.55LLKK22 pKa = 7.77KK23 pKa = 9.13TRR25 pKa = 11.84IARR28 pKa = 11.84RR29 pKa = 11.84NKK31 pKa = 9.8KK32 pKa = 9.86
MM1 pKa = 7.28GSVVKK6 pKa = 10.49KK7 pKa = 9.45RR8 pKa = 11.84RR9 pKa = 11.84KK10 pKa = 9.48RR11 pKa = 11.84MAKK14 pKa = 9.41KK15 pKa = 9.99KK16 pKa = 9.77HH17 pKa = 5.81RR18 pKa = 11.84KK19 pKa = 8.55LLKK22 pKa = 7.77KK23 pKa = 9.13TRR25 pKa = 11.84IARR28 pKa = 11.84RR29 pKa = 11.84NKK31 pKa = 9.8KK32 pKa = 9.86
Molecular weight: 3.96 kDa
Isoelectric point according different methods:
Peptides (in silico digests for buttom-up proteomics)
Below you can find in silico digests of the whole proteome with Trypsin, Chymotrypsin, Trypsin+LysC, LysN, ArgC proteases suitable for different mass spec machines.| Try ESI |
 |
|---|
| ChTry ESI |
|
|---|
| ArgC ESI |
|
|---|
| LysN ESI |
|
|---|
| TryLysC ESI |
|
|---|
| Try MALDI |
|
|---|
| ChTry MALDI |
|
|---|
| ArgC MALDI |
|
|---|
| LysN MALDI |
|
|---|
| TryLysC MALDI |
|
|---|
| Try LTQ |
|
|---|
| ChTry LTQ |
|
|---|
| ArgC LTQ |
|
|---|
| LysN LTQ |
|
|---|
| TryLysC LTQ |
|
|---|
| Try MSlow |
|
|---|
| ChTry MSlow |
|
|---|
| ArgC MSlow |
|
|---|
| LysN MSlow |
|
|---|
| TryLysC MSlow |
|
|---|
| Try MShigh |
|
|---|
| ChTry MShigh |
|
|---|
| ArgC MShigh |
|
|---|
| LysN MShigh |
|
|---|
| TryLysC MShigh |
|
|---|
General Statistics
Number of major isoforms |
Number of additional isoforms |
Number of all proteins |
Number of amino acids |
Min. Seq. Length |
Max. Seq. Length |
Avg. Seq. Length |
Avg. Mol. Weight |
|---|---|---|---|---|---|---|---|
0 |
1025469 |
32 |
3629 |
332.4 |
35.99 |
Amino acid frequency
Ala |
Cys |
Asp |
Glu |
Phe |
Gly |
His |
Ile |
Lys |
Leu |
|---|---|---|---|---|---|---|---|---|---|
12.602 ± 0.061 | 0.803 ± 0.011 |
5.816 ± 0.039 | 6.348 ± 0.042 |
2.827 ± 0.022 | 8.379 ± 0.042 |
2.321 ± 0.019 | 3.881 ± 0.029 |
1.997 ± 0.032 | 10.412 ± 0.05 |
Met |
Asn |
Gln |
Pro |
Arg |
Ser |
Thr |
Val |
Trp |
Tyr |
|---|---|---|---|---|---|---|---|---|---|
1.747 ± 0.017 | 1.953 ± 0.024 |
6.117 ± 0.043 | 3.004 ± 0.028 |
8.2 ± 0.047 | 5.215 ± 0.033 |
6.001 ± 0.029 | 8.693 ± 0.046 |
1.496 ± 0.018 | 2.185 ± 0.02 |
Most of the basic statistics you can see at this page can be downloaded from this CSV file
See this proteome in:

Proteome-pI is available under Creative Commons Attribution-NoDerivs license, for more details see here
| Reference: Kozlowski LP. Proteome-pI 2.0: Proteome Isoelectric Point Database Update. Nucleic Acids Res. 2021, doi: 10.1093/nar/gkab944 | Contact: Lukasz P. Kozlowski |