Tortoise microvirus 33
Taxonomy: Viruses; Monodnaviria; Sangervirae; Phixviricota; Malgrandaviricetes; Petitvirales; Microviridae; unclassified Microviridae
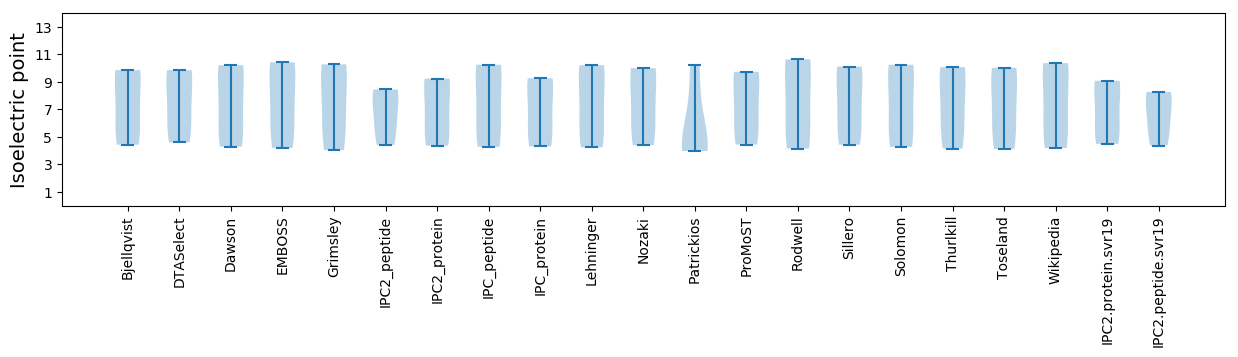
Average proteome isoelectric point is 6.99
Get precalculated fractions of proteins
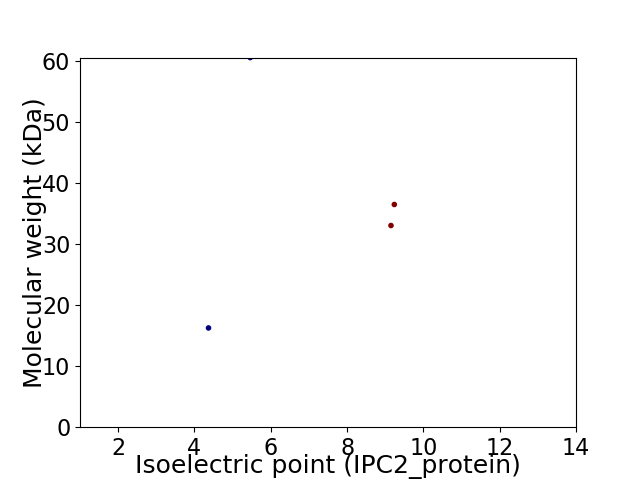
Virtual 2D-PAGE plot for 4 proteins (isoelectric point calculated using IPC2_protein)
Get csv file with sequences according to given criteria:
* You can choose from 21 different methods for calculating isoelectric point
Summary statistics related to proteome-wise predictions
Protein with the lowest isoelectric point:
>tr|A0A4P8W671|A0A4P8W671_9VIRU Major capsid protein OS=Tortoise microvirus 33 OX=2583136 PE=3 SV=1
MM1 pKa = 7.99LFRR4 pKa = 11.84TQYY7 pKa = 11.36NFVLGNSEE15 pKa = 4.19TDD17 pKa = 3.1VTTITEE23 pKa = 4.42PSQTVPDD30 pKa = 3.73EE31 pKa = 4.19SLTIRR36 pKa = 11.84EE37 pKa = 3.83IFEE40 pKa = 4.23RR41 pKa = 11.84YY42 pKa = 7.62ATGRR46 pKa = 11.84PLDD49 pKa = 3.81VVDD52 pKa = 3.74SRR54 pKa = 11.84GIYY57 pKa = 9.83TEE59 pKa = 4.63DD60 pKa = 4.26KK61 pKa = 10.74VGKK64 pKa = 10.32DD65 pKa = 3.93PDD67 pKa = 3.86FDD69 pKa = 6.61DD70 pKa = 6.08YY71 pKa = 12.17DD72 pKa = 4.33DD73 pKa = 5.52LCDD76 pKa = 4.14PNADD80 pKa = 3.0ISDD83 pKa = 3.83FHH85 pKa = 7.78AQAAYY90 pKa = 9.82EE91 pKa = 3.98YY92 pKa = 10.63AYY94 pKa = 10.52MLDD97 pKa = 3.35EE98 pKa = 4.81EE99 pKa = 4.55KK100 pKa = 10.56RR101 pKa = 11.84KK102 pKa = 10.01KK103 pKa = 10.59DD104 pKa = 3.25SAKK107 pKa = 10.36KK108 pKa = 9.84KK109 pKa = 9.59RR110 pKa = 11.84QEE112 pKa = 4.07EE113 pKa = 3.44FDD115 pKa = 3.61KK116 pKa = 10.93RR117 pKa = 11.84VKK119 pKa = 10.75EE120 pKa = 3.97EE121 pKa = 3.92AQRR124 pKa = 11.84MMNDD128 pKa = 3.25NSQSSDD134 pKa = 3.47DD135 pKa = 4.31AKK137 pKa = 11.33VEE139 pKa = 4.25SS140 pKa = 4.18
MM1 pKa = 7.99LFRR4 pKa = 11.84TQYY7 pKa = 11.36NFVLGNSEE15 pKa = 4.19TDD17 pKa = 3.1VTTITEE23 pKa = 4.42PSQTVPDD30 pKa = 3.73EE31 pKa = 4.19SLTIRR36 pKa = 11.84EE37 pKa = 3.83IFEE40 pKa = 4.23RR41 pKa = 11.84YY42 pKa = 7.62ATGRR46 pKa = 11.84PLDD49 pKa = 3.81VVDD52 pKa = 3.74SRR54 pKa = 11.84GIYY57 pKa = 9.83TEE59 pKa = 4.63DD60 pKa = 4.26KK61 pKa = 10.74VGKK64 pKa = 10.32DD65 pKa = 3.93PDD67 pKa = 3.86FDD69 pKa = 6.61DD70 pKa = 6.08YY71 pKa = 12.17DD72 pKa = 4.33DD73 pKa = 5.52LCDD76 pKa = 4.14PNADD80 pKa = 3.0ISDD83 pKa = 3.83FHH85 pKa = 7.78AQAAYY90 pKa = 9.82EE91 pKa = 3.98YY92 pKa = 10.63AYY94 pKa = 10.52MLDD97 pKa = 3.35EE98 pKa = 4.81EE99 pKa = 4.55KK100 pKa = 10.56RR101 pKa = 11.84KK102 pKa = 10.01KK103 pKa = 10.59DD104 pKa = 3.25SAKK107 pKa = 10.36KK108 pKa = 9.84KK109 pKa = 9.59RR110 pKa = 11.84QEE112 pKa = 4.07EE113 pKa = 3.44FDD115 pKa = 3.61KK116 pKa = 10.93RR117 pKa = 11.84VKK119 pKa = 10.75EE120 pKa = 3.97EE121 pKa = 3.92AQRR124 pKa = 11.84MMNDD128 pKa = 3.25NSQSSDD134 pKa = 3.47DD135 pKa = 4.31AKK137 pKa = 11.33VEE139 pKa = 4.25SS140 pKa = 4.18
Molecular weight: 16.24 kDa
Isoelectric point according different methods:
Protein with the highest isoelectric point:
>tr|A0A4V1FVX8|A0A4V1FVX8_9VIRU DNA pilot protein OS=Tortoise microvirus 33 OX=2583136 PE=4 SV=1
MM1 pKa = 7.62SILGSAAIAGGASLIGGAISGLFGSKK27 pKa = 9.47SSKK30 pKa = 10.04KK31 pKa = 10.06ANQSNEE37 pKa = 3.57RR38 pKa = 11.84LAAQQNEE45 pKa = 4.41YY46 pKa = 10.46NLQYY50 pKa = 10.27QANEE54 pKa = 3.68FAQNQKK60 pKa = 9.71MSDD63 pKa = 3.18LEE65 pKa = 4.11YY66 pKa = 10.85QRR68 pKa = 11.84NLEE71 pKa = 3.96QWHH74 pKa = 6.19LQNEE78 pKa = 4.66YY79 pKa = 10.94NSPAQQRR86 pKa = 11.84QRR88 pKa = 11.84LVEE91 pKa = 4.64AGLNPNLVYY100 pKa = 10.9GSGTASAGNATGSPQYY116 pKa = 10.31QAARR120 pKa = 11.84YY121 pKa = 7.24KK122 pKa = 10.9APNAEE127 pKa = 4.2RR128 pKa = 11.84ATVHH132 pKa = 5.82PQGFVPPAIDD142 pKa = 4.16PYY144 pKa = 10.57QAVGLGQQLAMQKK157 pKa = 10.34AQVSQLAAQTEE168 pKa = 4.64FTKK171 pKa = 10.83QQTANAALEE180 pKa = 4.44SLFKK184 pKa = 9.73TARR187 pKa = 11.84TAGVHH192 pKa = 6.54LDD194 pKa = 3.57NAKK197 pKa = 10.35KK198 pKa = 10.61SSLFDD203 pKa = 3.84LSIDD207 pKa = 3.51QARR210 pKa = 11.84ANLAKK215 pKa = 9.04TQSSTSLDD223 pKa = 3.54SARR226 pKa = 11.84LDD228 pKa = 3.56LQRR231 pKa = 11.84VLNDD235 pKa = 3.4RR236 pKa = 11.84ARR238 pKa = 11.84ALAPLQVKK246 pKa = 8.93QLQTSIDD253 pKa = 3.67RR254 pKa = 11.84LKK256 pKa = 9.94VTRR259 pKa = 11.84DD260 pKa = 2.85LDD262 pKa = 3.72AFRR265 pKa = 11.84LQLLRR270 pKa = 11.84LGISDD275 pKa = 3.82KK276 pKa = 11.38DD277 pKa = 3.74GLVSRR282 pKa = 11.84LAARR286 pKa = 11.84WLIDD290 pKa = 3.49PANSSAVDD298 pKa = 3.76SIKK301 pKa = 11.12NFFSPSQFVKK311 pKa = 10.55DD312 pKa = 3.55VRR314 pKa = 11.84HH315 pKa = 6.26DD316 pKa = 3.91VGAIWNIFKK325 pKa = 9.06KK326 pKa = 8.88TPRR329 pKa = 11.84GFIGRR334 pKa = 3.9
MM1 pKa = 7.62SILGSAAIAGGASLIGGAISGLFGSKK27 pKa = 9.47SSKK30 pKa = 10.04KK31 pKa = 10.06ANQSNEE37 pKa = 3.57RR38 pKa = 11.84LAAQQNEE45 pKa = 4.41YY46 pKa = 10.46NLQYY50 pKa = 10.27QANEE54 pKa = 3.68FAQNQKK60 pKa = 9.71MSDD63 pKa = 3.18LEE65 pKa = 4.11YY66 pKa = 10.85QRR68 pKa = 11.84NLEE71 pKa = 3.96QWHH74 pKa = 6.19LQNEE78 pKa = 4.66YY79 pKa = 10.94NSPAQQRR86 pKa = 11.84QRR88 pKa = 11.84LVEE91 pKa = 4.64AGLNPNLVYY100 pKa = 10.9GSGTASAGNATGSPQYY116 pKa = 10.31QAARR120 pKa = 11.84YY121 pKa = 7.24KK122 pKa = 10.9APNAEE127 pKa = 4.2RR128 pKa = 11.84ATVHH132 pKa = 5.82PQGFVPPAIDD142 pKa = 4.16PYY144 pKa = 10.57QAVGLGQQLAMQKK157 pKa = 10.34AQVSQLAAQTEE168 pKa = 4.64FTKK171 pKa = 10.83QQTANAALEE180 pKa = 4.44SLFKK184 pKa = 9.73TARR187 pKa = 11.84TAGVHH192 pKa = 6.54LDD194 pKa = 3.57NAKK197 pKa = 10.35KK198 pKa = 10.61SSLFDD203 pKa = 3.84LSIDD207 pKa = 3.51QARR210 pKa = 11.84ANLAKK215 pKa = 9.04TQSSTSLDD223 pKa = 3.54SARR226 pKa = 11.84LDD228 pKa = 3.56LQRR231 pKa = 11.84VLNDD235 pKa = 3.4RR236 pKa = 11.84ARR238 pKa = 11.84ALAPLQVKK246 pKa = 8.93QLQTSIDD253 pKa = 3.67RR254 pKa = 11.84LKK256 pKa = 9.94VTRR259 pKa = 11.84DD260 pKa = 2.85LDD262 pKa = 3.72AFRR265 pKa = 11.84LQLLRR270 pKa = 11.84LGISDD275 pKa = 3.82KK276 pKa = 11.38DD277 pKa = 3.74GLVSRR282 pKa = 11.84LAARR286 pKa = 11.84WLIDD290 pKa = 3.49PANSSAVDD298 pKa = 3.76SIKK301 pKa = 11.12NFFSPSQFVKK311 pKa = 10.55DD312 pKa = 3.55VRR314 pKa = 11.84HH315 pKa = 6.26DD316 pKa = 3.91VGAIWNIFKK325 pKa = 9.06KK326 pKa = 8.88TPRR329 pKa = 11.84GFIGRR334 pKa = 3.9
Molecular weight: 36.46 kDa
Isoelectric point according different methods:
Peptides (in silico digests for buttom-up proteomics)
Below you can find in silico digests of the whole proteome with Trypsin, Chymotrypsin, Trypsin+LysC, LysN, ArgC proteases suitable for different mass spec machines.| Try ESI |
 |
|---|
| ChTry ESI |
|
|---|
| ArgC ESI |
|
|---|
| LysN ESI |
|
|---|
| TryLysC ESI |
|
|---|
| Try MALDI |
|
|---|
| ChTry MALDI |
|
|---|
| ArgC MALDI |
|
|---|
| LysN MALDI |
|
|---|
| TryLysC MALDI |
|
|---|
| Try LTQ |
|
|---|
| ChTry LTQ |
|
|---|
| ArgC LTQ |
|
|---|
| LysN LTQ |
|
|---|
| TryLysC LTQ |
|
|---|
| Try MSlow |
|
|---|
| ChTry MSlow |
|
|---|
| ArgC MSlow |
|
|---|
| LysN MSlow |
|
|---|
| TryLysC MSlow |
|
|---|
| Try MShigh |
|
|---|
| ChTry MShigh |
|
|---|
| ArgC MShigh |
|
|---|
| LysN MShigh |
|
|---|
| TryLysC MShigh |
|
|---|
General Statistics
Number of major isoforms |
Number of additional isoforms |
Number of all proteins |
Number of amino acids |
Min. Seq. Length |
Max. Seq. Length |
Avg. Seq. Length |
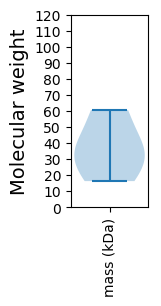
Avg. Mol. Weight |
|---|---|---|---|---|---|---|---|
0 |
1294 |
140 |
539 |
323.5 |
36.55 |
Amino acid frequency
Ala |
Cys |
Asp |
Glu |
Phe |
Gly |
His |
Ile |
Lys |
Leu |
|---|---|---|---|---|---|---|---|---|---|
8.578 ± 1.552 | 0.773 ± 0.498 |
6.801 ± 1.12 | 4.946 ± 0.847 |
5.1 ± 0.541 | 6.105 ± 0.828 |
1.855 ± 0.311 | 5.023 ± 0.784 |
5.41 ± 1.335 | 8.501 ± 0.873 |
Met |
Asn |
Gln |
Pro |
Arg |
Ser |
Thr |
Val |
Trp |
Tyr |
|---|---|---|---|---|---|---|---|---|---|
1.7 ± 0.268 | 4.173 ± 0.57 |
4.946 ± 0.739 | 5.255 ± 1.621 |
7.032 ± 0.623 | 8.346 ± 0.28 |
4.791 ± 0.373 | 5.023 ± 0.446 |
1.082 ± 0.191 | 4.56 ± 0.796 |
Most of the basic statistics you can see at this page can be downloaded from this CSV file
See this proteome in:

Proteome-pI is available under Creative Commons Attribution-NoDerivs license, for more details see here
| Reference: Kozlowski LP. Proteome-pI 2.0: Proteome Isoelectric Point Database Update. Nucleic Acids Res. 2021, doi: 10.1093/nar/gkab944 | Contact: Lukasz P. Kozlowski |