Staphylococcus virus IPLA35
Taxonomy: Viruses; Duplodnaviria; Heunggongvirae; Uroviricota; Caudoviricetes; Caudovirales; Siphoviridae; Triavirus
Average proteome isoelectric point is 6.47
Get precalculated fractions of proteins
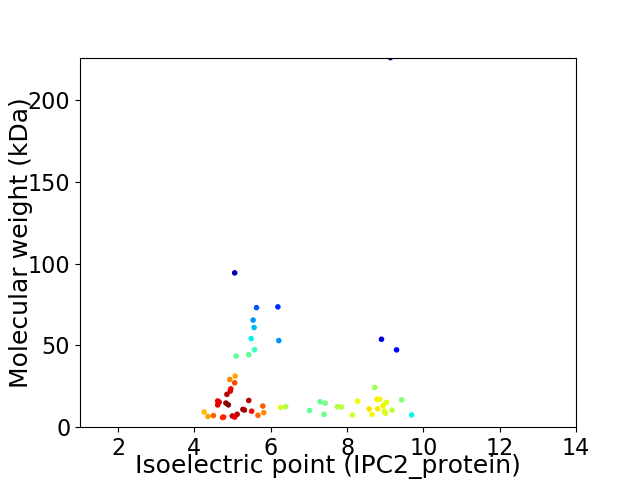
Virtual 2D-PAGE plot for 62 proteins (isoelectric point calculated using IPC2_protein)
Get csv file with sequences according to given criteria:
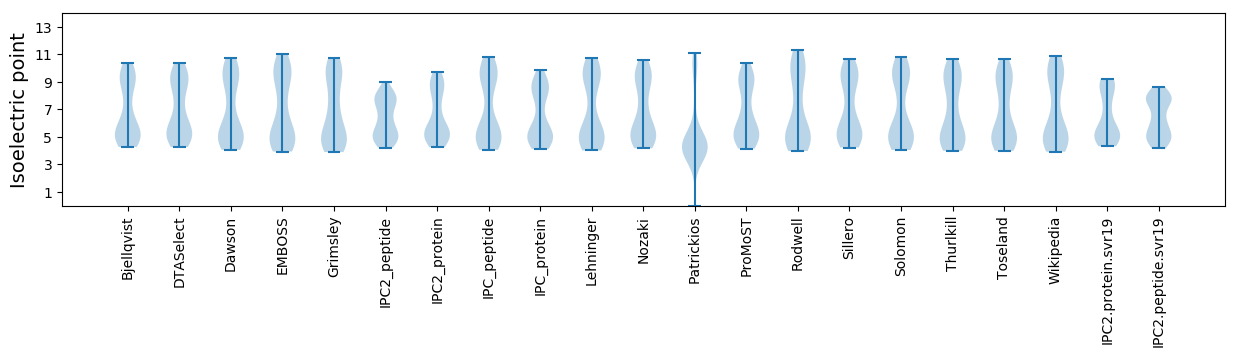
* You can choose from 21 different methods for calculating isoelectric point
Summary statistics related to proteome-wise predictions
Protein with the lowest isoelectric point:
>tr|B7T0K9|B7T0K9_9CAUD Gp58 OS=Staphylococcus virus IPLA35 OX=575610 PE=4 SV=1
MM1 pKa = 7.66LKK3 pKa = 10.44LISPTFEE10 pKa = 6.11DD11 pKa = 2.99IKK13 pKa = 10.15TWYY16 pKa = 8.82QLKK19 pKa = 10.0EE20 pKa = 3.87YY21 pKa = 10.27SKK23 pKa = 11.37EE24 pKa = 4.08DD25 pKa = 3.27IAWYY29 pKa = 10.85VDD31 pKa = 3.16MEE33 pKa = 4.57VIDD36 pKa = 3.95KK37 pKa = 10.8EE38 pKa = 4.28EE39 pKa = 3.79YY40 pKa = 10.74AIITGEE46 pKa = 4.12KK47 pKa = 9.76YY48 pKa = 10.36PEE50 pKa = 4.08NLEE53 pKa = 4.23SS54 pKa = 3.57
MM1 pKa = 7.66LKK3 pKa = 10.44LISPTFEE10 pKa = 6.11DD11 pKa = 2.99IKK13 pKa = 10.15TWYY16 pKa = 8.82QLKK19 pKa = 10.0EE20 pKa = 3.87YY21 pKa = 10.27SKK23 pKa = 11.37EE24 pKa = 4.08DD25 pKa = 3.27IAWYY29 pKa = 10.85VDD31 pKa = 3.16MEE33 pKa = 4.57VIDD36 pKa = 3.95KK37 pKa = 10.8EE38 pKa = 4.28EE39 pKa = 3.79YY40 pKa = 10.74AIITGEE46 pKa = 4.12KK47 pKa = 9.76YY48 pKa = 10.36PEE50 pKa = 4.08NLEE53 pKa = 4.23SS54 pKa = 3.57
Molecular weight: 6.54 kDa
Isoelectric point according different methods:
Protein with the highest isoelectric point:
>tr|B7T0H3|B7T0H3_9CAUD Gp22 OS=Staphylococcus virus IPLA35 OX=575610 PE=4 SV=1
MM1 pKa = 7.3ATNTLEE7 pKa = 4.17LSSTINQRR15 pKa = 11.84YY16 pKa = 9.51KK17 pKa = 10.74YY18 pKa = 8.6DD19 pKa = 3.76TAGKK23 pKa = 8.11TPTQIQSEE31 pKa = 4.3LRR33 pKa = 11.84KK34 pKa = 10.05KK35 pKa = 9.95GLQGFVVKK43 pKa = 10.76VSGRR47 pKa = 11.84KK48 pKa = 6.58VTMKK52 pKa = 10.66VMEE55 pKa = 3.89QHH57 pKa = 6.01IKK59 pKa = 10.52SNRR62 pKa = 11.84GCMRR66 pKa = 4.15
MM1 pKa = 7.3ATNTLEE7 pKa = 4.17LSSTINQRR15 pKa = 11.84YY16 pKa = 9.51KK17 pKa = 10.74YY18 pKa = 8.6DD19 pKa = 3.76TAGKK23 pKa = 8.11TPTQIQSEE31 pKa = 4.3LRR33 pKa = 11.84KK34 pKa = 10.05KK35 pKa = 9.95GLQGFVVKK43 pKa = 10.76VSGRR47 pKa = 11.84KK48 pKa = 6.58VTMKK52 pKa = 10.66VMEE55 pKa = 3.89QHH57 pKa = 6.01IKK59 pKa = 10.52SNRR62 pKa = 11.84GCMRR66 pKa = 4.15
Molecular weight: 7.5 kDa
Isoelectric point according different methods:
Peptides (in silico digests for buttom-up proteomics)
Below you can find in silico digests of the whole proteome with Trypsin, Chymotrypsin, Trypsin+LysC, LysN, ArgC proteases suitable for different mass spec machines.| Try ESI |
 |
|---|
| ChTry ESI |
|
|---|
| ArgC ESI |
|
|---|
| LysN ESI |
|
|---|
| TryLysC ESI |
|
|---|
| Try MALDI |
|
|---|
| ChTry MALDI |
|
|---|
| ArgC MALDI |
|
|---|
| LysN MALDI |
|
|---|
| TryLysC MALDI |
|
|---|
| Try LTQ |
|
|---|
| ChTry LTQ |
|
|---|
| ArgC LTQ |
|
|---|
| LysN LTQ |
|
|---|
| TryLysC LTQ |
|
|---|
| Try MSlow |
|
|---|
| ChTry MSlow |
|
|---|
| ArgC MSlow |
|
|---|
| LysN MSlow |
|
|---|
| TryLysC MSlow |
|
|---|
| Try MShigh |
|
|---|
| ChTry MShigh |
|
|---|
| ArgC MShigh |
|
|---|
| LysN MShigh |
|
|---|
| TryLysC MShigh |
|
|---|
General Statistics
Number of major isoforms |
Number of additional isoforms |
Number of all proteins |
Number of amino acids |
Min. Seq. Length |
Max. Seq. Length |
Avg. Seq. Length |
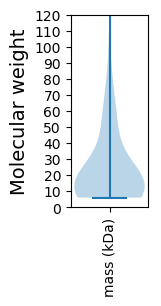
Avg. Mol. Weight |
|---|---|---|---|---|---|---|---|
0 |
13889 |
50 |
2066 |
224.0 |
25.61 |
Amino acid frequency
Ala |
Cys |
Asp |
Glu |
Phe |
Gly |
His |
Ile |
Lys |
Leu |
|---|---|---|---|---|---|---|---|---|---|
5.918 ± 0.596 | 0.475 ± 0.1 |
6.084 ± 0.26 | 7.74 ± 0.422 |
3.946 ± 0.245 | 5.962 ± 0.559 |
1.735 ± 0.138 | 7.042 ± 0.36 |
9.886 ± 0.473 | 8.374 ± 0.261 |
Met |
Asn |
Gln |
Pro |
Arg |
Ser |
Thr |
Val |
Trp |
Tyr |
|---|---|---|---|---|---|---|---|---|---|
2.556 ± 0.125 | 6.365 ± 0.273 |
2.714 ± 0.198 | 3.722 ± 0.147 |
4.126 ± 0.208 | 6.365 ± 0.317 |
5.753 ± 0.277 | 5.623 ± 0.224 |
1.267 ± 0.13 | 4.349 ± 0.355 |
Most of the basic statistics you can see at this page can be downloaded from this CSV file
See this proteome in:

Proteome-pI is available under Creative Commons Attribution-NoDerivs license, for more details see here
| Reference: Kozlowski LP. Proteome-pI 2.0: Proteome Isoelectric Point Database Update. Nucleic Acids Res. 2021, doi: 10.1093/nar/gkab944 | Contact: Lukasz P. Kozlowski |