Acidianus hospitalis (strain W1)
Taxonomy: cellular organisms; Archaea; TACK group; Crenarchaeota; Thermoprotei; Sulfolobales; Sulfolobaceae; Acidianus; Acidianus hospitalis
Average proteome isoelectric point is 6.85
Get precalculated fractions of proteins
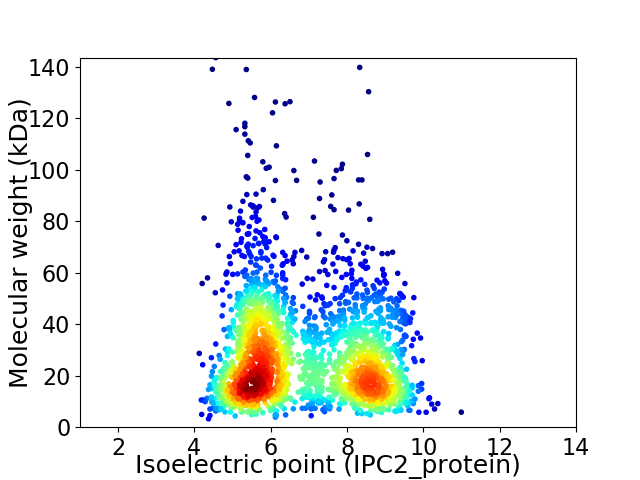
Virtual 2D-PAGE plot for 2329 proteins (isoelectric point calculated using IPC2_protein)
Get csv file with sequences according to given criteria:
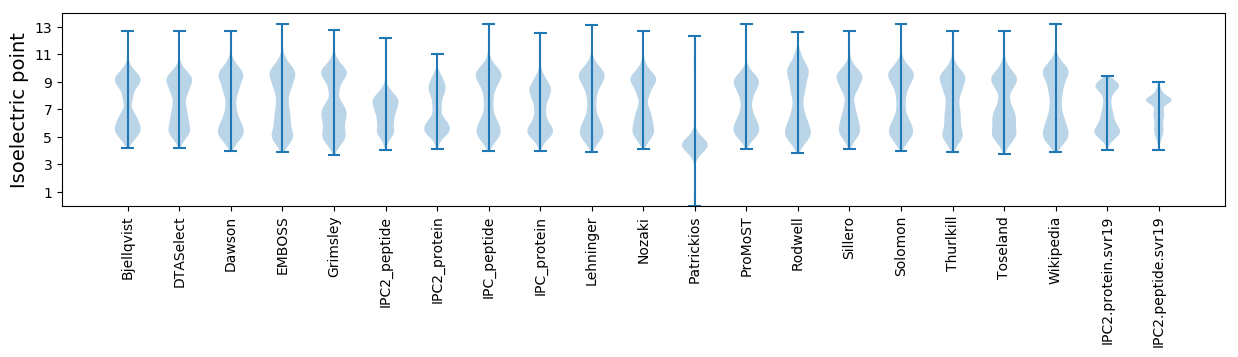
* You can choose from 21 different methods for calculating isoelectric point
Summary statistics related to proteome-wise predictions
Protein with the lowest isoelectric point:
>tr|F4B676|F4B676_ACIHW 4-hydroxybenzoate polyprenyltransferase OS=Acidianus hospitalis (strain W1) OX=933801 GN=Ahos_0476 PE=4 SV=1
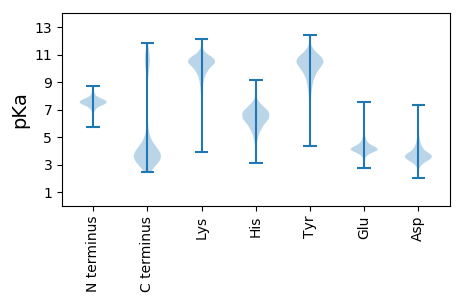
MM1 pKa = 7.2AQAEE5 pKa = 4.54FVFEE9 pKa = 4.17EE10 pKa = 4.46TVRR13 pKa = 11.84IYY15 pKa = 10.47DD16 pKa = 3.56TDD18 pKa = 3.71TQGIAHH24 pKa = 6.3YY25 pKa = 10.56ASYY28 pKa = 11.42
MM1 pKa = 7.2AQAEE5 pKa = 4.54FVFEE9 pKa = 4.17EE10 pKa = 4.46TVRR13 pKa = 11.84IYY15 pKa = 10.47DD16 pKa = 3.56TDD18 pKa = 3.71TQGIAHH24 pKa = 6.3YY25 pKa = 10.56ASYY28 pKa = 11.42
Molecular weight: 3.26 kDa
Isoelectric point according different methods:
Protein with the highest isoelectric point:
>tr|F4B464|F4B464_ACIHW Translation initiation factor 6 OS=Acidianus hospitalis (strain W1) OX=933801 GN=eif6 PE=3 SV=1
MM1 pKa = 7.24STTKK5 pKa = 10.4PLAKK9 pKa = 10.1KK10 pKa = 10.25LRR12 pKa = 11.84LAKK15 pKa = 10.29ALKK18 pKa = 10.3SNSAIPAWVILKK30 pKa = 9.3TNGKK34 pKa = 9.17VRR36 pKa = 11.84INPLRR41 pKa = 11.84RR42 pKa = 11.84NWRR45 pKa = 11.84RR46 pKa = 11.84NSLKK50 pKa = 10.65VV51 pKa = 3.18
MM1 pKa = 7.24STTKK5 pKa = 10.4PLAKK9 pKa = 10.1KK10 pKa = 10.25LRR12 pKa = 11.84LAKK15 pKa = 10.29ALKK18 pKa = 10.3SNSAIPAWVILKK30 pKa = 9.3TNGKK34 pKa = 9.17VRR36 pKa = 11.84INPLRR41 pKa = 11.84RR42 pKa = 11.84NWRR45 pKa = 11.84RR46 pKa = 11.84NSLKK50 pKa = 10.65VV51 pKa = 3.18
Molecular weight: 5.84 kDa
Isoelectric point according different methods:
Peptides (in silico digests for buttom-up proteomics)
Below you can find in silico digests of the whole proteome with Trypsin, Chymotrypsin, Trypsin+LysC, LysN, ArgC proteases suitable for different mass spec machines.| Try ESI |
 |
|---|
| ChTry ESI |
|
|---|
| ArgC ESI |
|
|---|
| LysN ESI |
|
|---|
| TryLysC ESI |
|
|---|
| Try MALDI |
|
|---|
| ChTry MALDI |
|
|---|
| ArgC MALDI |
|
|---|
| LysN MALDI |
|
|---|
| TryLysC MALDI |
|
|---|
| Try LTQ |
|
|---|
| ChTry LTQ |
|
|---|
| ArgC LTQ |
|
|---|
| LysN LTQ |
|
|---|
| TryLysC LTQ |
|
|---|
| Try MSlow |
|
|---|
| ChTry MSlow |
|
|---|
| ArgC MSlow |
|
|---|
| LysN MSlow |
|
|---|
| TryLysC MSlow |
|
|---|
| Try MShigh |
|
|---|
| ChTry MShigh |
|
|---|
| ArgC MShigh |
|
|---|
| LysN MShigh |
|
|---|
| TryLysC MShigh |
|
|---|
General Statistics
Number of major isoforms |
Number of additional isoforms |
Number of all proteins |
Number of amino acids |
Min. Seq. Length |
Max. Seq. Length |
Avg. Seq. Length |
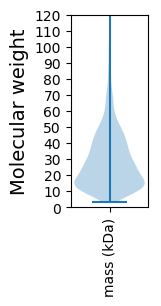
Avg. Mol. Weight |
|---|---|---|---|---|---|---|---|
0 |
620352 |
28 |
1321 |
266.4 |
30.1 |
Amino acid frequency
Ala |
Cys |
Asp |
Glu |
Phe |
Gly |
His |
Ile |
Lys |
Leu |
|---|---|---|---|---|---|---|---|---|---|
5.79 ± 0.049 | 0.791 ± 0.02 |
4.806 ± 0.043 | 7.306 ± 0.06 |
4.501 ± 0.048 | 6.499 ± 0.049 |
1.277 ± 0.016 | 9.778 ± 0.052 |
8.289 ± 0.061 | 9.994 ± 0.056 |
Met |
Asn |
Gln |
Pro |
Arg |
Ser |
Thr |
Val |
Trp |
Tyr |
|---|---|---|---|---|---|---|---|---|---|
2.243 ± 0.023 | 4.708 ± 0.04 |
3.881 ± 0.039 | 2.031 ± 0.025 |
4.032 ± 0.041 | 6.777 ± 0.053 |
4.536 ± 0.043 | 7.091 ± 0.043 |
0.963 ± 0.02 | 4.707 ± 0.041 |
Most of the basic statistics you can see at this page can be downloaded from this CSV file
See this proteome in:

Proteome-pI is available under Creative Commons Attribution-NoDerivs license, for more details see here
| Reference: Kozlowski LP. Proteome-pI 2.0: Proteome Isoelectric Point Database Update. Nucleic Acids Res. 2021, doi: 10.1093/nar/gkab944 | Contact: Lukasz P. Kozlowski |