Caballeronia glathei
Taxonomy: cellular organisms; Bacteria; Proteobacteria;
Average proteome isoelectric point is 6.78
Get precalculated fractions of proteins
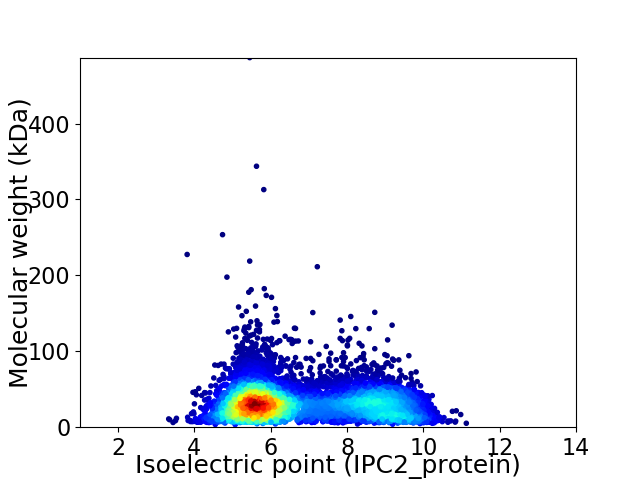
Virtual 2D-PAGE plot for 7464 proteins (isoelectric point calculated using IPC2_protein)
Get csv file with sequences according to given criteria:
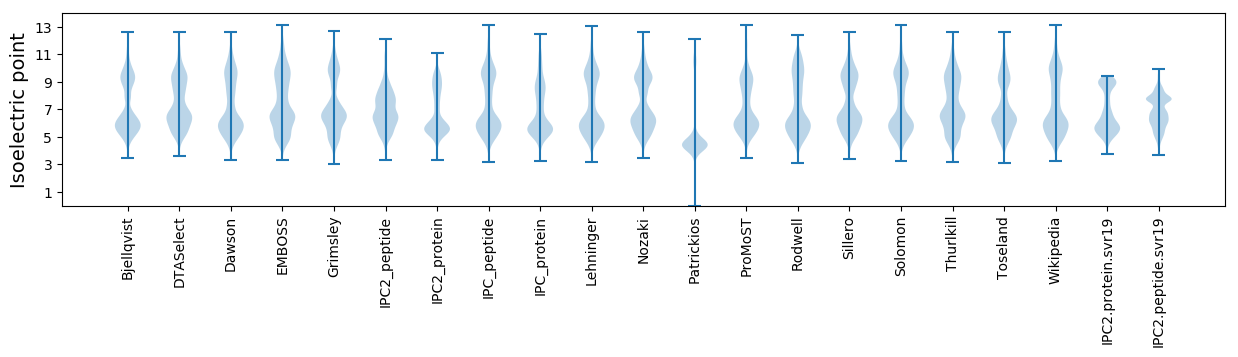
* You can choose from 21 different methods for calculating isoelectric point
Summary statistics related to proteome-wise predictions
Protein with the lowest isoelectric point:
>tr|A0A069Q019|A0A069Q019_9BURK LUD_dom domain-containing protein OS=Caballeronia glathei OX=60547 GN=BG61_02010 PE=4 SV=1
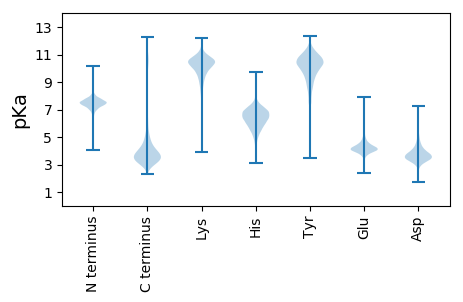
MM1 pKa = 7.44FFFPPPPGAGGLAPWQTQTQPNTADD26 pKa = 3.76LYY28 pKa = 10.48TFLTTVAGVPTAALPSNSPYY48 pKa = 10.62LAWALSFSEE57 pKa = 4.51EE58 pKa = 3.77NTLLVLRR65 pKa = 11.84AVGQDD70 pKa = 3.45YY71 pKa = 11.23YY72 pKa = 11.63CFAVYY77 pKa = 10.71LLATSFLINWAPDD90 pKa = 3.25QLGQTFFADD99 pKa = 5.97LRR101 pKa = 11.84NTWNISGFVGGIVQSTADD119 pKa = 3.34QGTSEE124 pKa = 4.77SMTMPDD130 pKa = 4.13FLNGLTLGQLQALKK144 pKa = 10.83DD145 pKa = 3.57PFGRR149 pKa = 11.84QWLAMSQEE157 pKa = 4.66LGPIWGISS165 pKa = 3.18
MM1 pKa = 7.44FFFPPPPGAGGLAPWQTQTQPNTADD26 pKa = 3.76LYY28 pKa = 10.48TFLTTVAGVPTAALPSNSPYY48 pKa = 10.62LAWALSFSEE57 pKa = 4.51EE58 pKa = 3.77NTLLVLRR65 pKa = 11.84AVGQDD70 pKa = 3.45YY71 pKa = 11.23YY72 pKa = 11.63CFAVYY77 pKa = 10.71LLATSFLINWAPDD90 pKa = 3.25QLGQTFFADD99 pKa = 5.97LRR101 pKa = 11.84NTWNISGFVGGIVQSTADD119 pKa = 3.34QGTSEE124 pKa = 4.77SMTMPDD130 pKa = 4.13FLNGLTLGQLQALKK144 pKa = 10.83DD145 pKa = 3.57PFGRR149 pKa = 11.84QWLAMSQEE157 pKa = 4.66LGPIWGISS165 pKa = 3.18
Molecular weight: 17.97 kDa
Isoelectric point according different methods:
Protein with the highest isoelectric point:
>tr|A0A069PHM9|A0A069PHM9_9BURK HTH gntR-type domain-containing protein OS=Caballeronia glathei OX=60547 GN=BG61_26915 PE=3 SV=1
MM1 pKa = 7.35KK2 pKa = 9.36RR3 pKa = 11.84TYY5 pKa = 10.06QPSVTRR11 pKa = 11.84RR12 pKa = 11.84KK13 pKa = 8.0RR14 pKa = 11.84THH16 pKa = 5.76GFRR19 pKa = 11.84VRR21 pKa = 11.84MKK23 pKa = 8.74TAGGRR28 pKa = 11.84KK29 pKa = 9.04VINARR34 pKa = 11.84RR35 pKa = 11.84AKK37 pKa = 9.58GRR39 pKa = 11.84KK40 pKa = 8.75RR41 pKa = 11.84LAVV44 pKa = 3.41
MM1 pKa = 7.35KK2 pKa = 9.36RR3 pKa = 11.84TYY5 pKa = 10.06QPSVTRR11 pKa = 11.84RR12 pKa = 11.84KK13 pKa = 8.0RR14 pKa = 11.84THH16 pKa = 5.76GFRR19 pKa = 11.84VRR21 pKa = 11.84MKK23 pKa = 8.74TAGGRR28 pKa = 11.84KK29 pKa = 9.04VINARR34 pKa = 11.84RR35 pKa = 11.84AKK37 pKa = 9.58GRR39 pKa = 11.84KK40 pKa = 8.75RR41 pKa = 11.84LAVV44 pKa = 3.41
Molecular weight: 5.18 kDa
Isoelectric point according different methods:
Peptides (in silico digests for buttom-up proteomics)
Below you can find in silico digests of the whole proteome with Trypsin, Chymotrypsin, Trypsin+LysC, LysN, ArgC proteases suitable for different mass spec machines.| Try ESI |
 |
|---|
| ChTry ESI |
|
|---|
| ArgC ESI |
|
|---|
| LysN ESI |
|
|---|
| TryLysC ESI |
|
|---|
| Try MALDI |
|
|---|
| ChTry MALDI |
|
|---|
| ArgC MALDI |
|
|---|
| LysN MALDI |
|
|---|
| TryLysC MALDI |
|
|---|
| Try LTQ |
|
|---|
| ChTry LTQ |
|
|---|
| ArgC LTQ |
|
|---|
| LysN LTQ |
|
|---|
| TryLysC LTQ |
|
|---|
| Try MSlow |
|
|---|
| ChTry MSlow |
|
|---|
| ArgC MSlow |
|
|---|
| LysN MSlow |
|
|---|
| TryLysC MSlow |
|
|---|
| Try MShigh |
|
|---|
| ChTry MShigh |
|
|---|
| ArgC MShigh |
|
|---|
| LysN MShigh |
|
|---|
| TryLysC MShigh |
|
|---|
General Statistics
Number of major isoforms |
Number of additional isoforms |
Number of all proteins |
Number of amino acids |
Min. Seq. Length |
Max. Seq. Length |
Avg. Seq. Length |
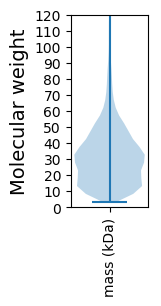
Avg. Mol. Weight |
|---|---|---|---|---|---|---|---|
0 |
2290966 |
30 |
4431 |
306.9 |
33.3 |
Amino acid frequency
Ala |
Cys |
Asp |
Glu |
Phe |
Gly |
His |
Ile |
Lys |
Leu |
|---|---|---|---|---|---|---|---|---|---|
12.877 ± 0.035 | 0.941 ± 0.009 |
5.398 ± 0.022 | 5.228 ± 0.025 |
3.771 ± 0.02 | 8.238 ± 0.027 |
2.296 ± 0.013 | 4.777 ± 0.019 |
3.099 ± 0.024 | 10.087 ± 0.036 |
Met |
Asn |
Gln |
Pro |
Arg |
Ser |
Thr |
Val |
Trp |
Tyr |
|---|---|---|---|---|---|---|---|---|---|
2.416 ± 0.012 | 2.711 ± 0.022 |
5.098 ± 0.019 | 3.409 ± 0.018 |
7.132 ± 0.033 | 5.667 ± 0.017 |
5.322 ± 0.019 | 7.81 ± 0.023 |
1.351 ± 0.011 | 2.37 ± 0.015 |
Most of the basic statistics you can see at this page can be downloaded from this CSV file
See this proteome in:

Proteome-pI is available under Creative Commons Attribution-NoDerivs license, for more details see here
| Reference: Kozlowski LP. Proteome-pI 2.0: Proteome Isoelectric Point Database Update. Nucleic Acids Res. 2021, doi: 10.1093/nar/gkab944 | Contact: Lukasz P. Kozlowski |