Corynebacterium aquilae DSM 44791
Taxonomy: cellular organisms; Bacteria; Terrabacteria group; Actinobacteria; Actinomycetia; Corynebacteriales; Corynebacteriaceae; Corynebacterium; Corynebacterium aquilae
Average proteome isoelectric point is 5.97
Get precalculated fractions of proteins
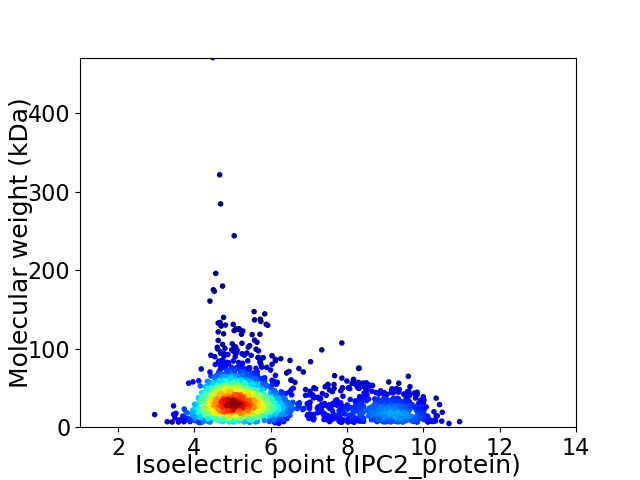
Virtual 2D-PAGE plot for 2002 proteins (isoelectric point calculated using IPC2_protein)
Get csv file with sequences according to given criteria:
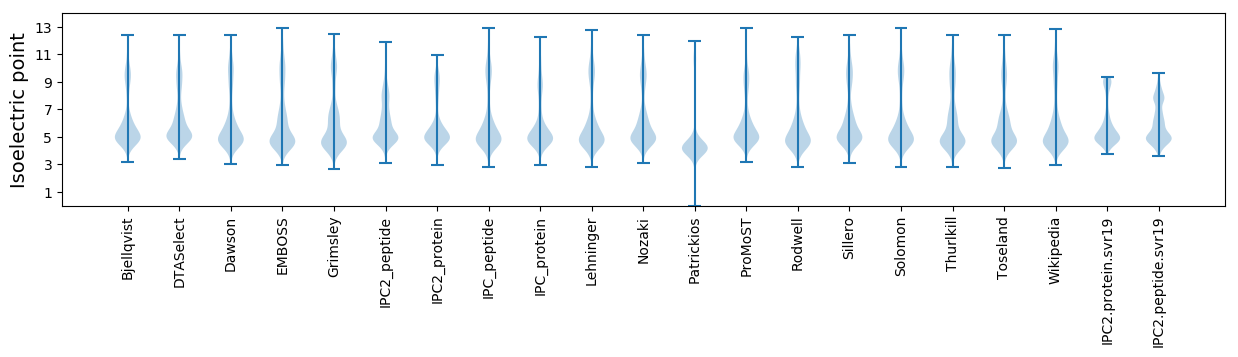
* You can choose from 21 different methods for calculating isoelectric point
Summary statistics related to proteome-wise predictions
Protein with the lowest isoelectric point:
>tr|A0A1L7CE29|A0A1L7CE29_9CORY ABC transporter substrate-binding protein OS=Corynebacterium aquilae DSM 44791 OX=1431546 GN=CAQU_02480 PE=4 SV=1
MM1 pKa = 7.21NAEE4 pKa = 3.89KK5 pKa = 9.91TLPRR9 pKa = 11.84VIRR12 pKa = 11.84RR13 pKa = 11.84ALAVGACTAPIVLVGCSNGGQSGPSTTVVTVTRR46 pKa = 11.84SSQSSTPSTSAAAPNSSAVAEE67 pKa = 4.39PKK69 pKa = 10.3KK70 pKa = 10.06DD71 pKa = 3.28THH73 pKa = 6.01SQNGGTDD80 pKa = 3.09GNTFVPEE87 pKa = 4.17HH88 pKa = 6.01FPVRR92 pKa = 11.84NDD94 pKa = 4.12LIEE97 pKa = 4.74GPPEE101 pKa = 3.97LQGKK105 pKa = 7.15TIVSCLGAEE114 pKa = 4.63HH115 pKa = 7.41PGQYY119 pKa = 10.71DD120 pKa = 3.21PGLTLLDD127 pKa = 4.42DD128 pKa = 4.37GTRR131 pKa = 11.84VWTAQCQMAYY141 pKa = 10.48DD142 pKa = 3.89YY143 pKa = 11.5GRR145 pKa = 11.84ADD147 pKa = 3.05IAGTDD152 pKa = 4.34DD153 pKa = 3.68YY154 pKa = 11.85SEE156 pKa = 4.64SDD158 pKa = 2.9SDD160 pKa = 5.0YY161 pKa = 11.41SDD163 pKa = 4.03TYY165 pKa = 11.85DD166 pKa = 4.29DD167 pKa = 5.41GYY169 pKa = 11.51SDD171 pKa = 5.01GYY173 pKa = 10.73DD174 pKa = 3.21AAVEE178 pKa = 4.28EE179 pKa = 4.57YY180 pKa = 10.92EE181 pKa = 4.51EE182 pKa = 4.32ALEE185 pKa = 4.57DD186 pKa = 3.97ALSEE190 pKa = 4.98LEE192 pKa = 4.52DD193 pKa = 3.56NN194 pKa = 4.67
MM1 pKa = 7.21NAEE4 pKa = 3.89KK5 pKa = 9.91TLPRR9 pKa = 11.84VIRR12 pKa = 11.84RR13 pKa = 11.84ALAVGACTAPIVLVGCSNGGQSGPSTTVVTVTRR46 pKa = 11.84SSQSSTPSTSAAAPNSSAVAEE67 pKa = 4.39PKK69 pKa = 10.3KK70 pKa = 10.06DD71 pKa = 3.28THH73 pKa = 6.01SQNGGTDD80 pKa = 3.09GNTFVPEE87 pKa = 4.17HH88 pKa = 6.01FPVRR92 pKa = 11.84NDD94 pKa = 4.12LIEE97 pKa = 4.74GPPEE101 pKa = 3.97LQGKK105 pKa = 7.15TIVSCLGAEE114 pKa = 4.63HH115 pKa = 7.41PGQYY119 pKa = 10.71DD120 pKa = 3.21PGLTLLDD127 pKa = 4.42DD128 pKa = 4.37GTRR131 pKa = 11.84VWTAQCQMAYY141 pKa = 10.48DD142 pKa = 3.89YY143 pKa = 11.5GRR145 pKa = 11.84ADD147 pKa = 3.05IAGTDD152 pKa = 4.34DD153 pKa = 3.68YY154 pKa = 11.85SEE156 pKa = 4.64SDD158 pKa = 2.9SDD160 pKa = 5.0YY161 pKa = 11.41SDD163 pKa = 4.03TYY165 pKa = 11.85DD166 pKa = 4.29DD167 pKa = 5.41GYY169 pKa = 11.51SDD171 pKa = 5.01GYY173 pKa = 10.73DD174 pKa = 3.21AAVEE178 pKa = 4.28EE179 pKa = 4.57YY180 pKa = 10.92EE181 pKa = 4.51EE182 pKa = 4.32ALEE185 pKa = 4.57DD186 pKa = 3.97ALSEE190 pKa = 4.98LEE192 pKa = 4.52DD193 pKa = 3.56NN194 pKa = 4.67
Molecular weight: 20.48 kDa
Isoelectric point according different methods:
Protein with the highest isoelectric point:
>tr|A0A1L7CD50|A0A1L7CD50_9CORY Uncharacterized protein OS=Corynebacterium aquilae DSM 44791 OX=1431546 GN=CAQU_00335 PE=3 SV=1
MM1 pKa = 7.28GVVIYY6 pKa = 10.52GSFGQLWWEE15 pKa = 3.59KK16 pKa = 9.66RR17 pKa = 11.84VRR19 pKa = 11.84VFVWRR24 pKa = 11.84CAPVFYY30 pKa = 11.04ALFTLVKK37 pKa = 10.24IPVTSGWKK45 pKa = 9.78SMANIFLAQPCAWRR59 pKa = 11.84VVSLQVLGCGKK70 pKa = 8.36TSYY73 pKa = 10.68RR74 pKa = 11.84KK75 pKa = 8.56GVVMAGHH82 pKa = 7.16RR83 pKa = 11.84EE84 pKa = 3.88PVSWRR89 pKa = 11.84EE90 pKa = 3.74QLRR93 pKa = 11.84ASLKK97 pKa = 8.93QTADD101 pKa = 3.27PDD103 pKa = 3.33ATIRR107 pKa = 11.84FGVGMGVLFFVLNSFRR123 pKa = 11.84DD124 pKa = 3.78EE125 pKa = 4.2VGLVLNLGLSLSLVAVFGIYY145 pKa = 10.45GLAARR150 pKa = 11.84NPGGRR155 pKa = 11.84PRR157 pKa = 11.84YY158 pKa = 9.15VRR160 pKa = 11.84GVVAAAVLIGVLAAALALVGQFFF183 pKa = 3.95
MM1 pKa = 7.28GVVIYY6 pKa = 10.52GSFGQLWWEE15 pKa = 3.59KK16 pKa = 9.66RR17 pKa = 11.84VRR19 pKa = 11.84VFVWRR24 pKa = 11.84CAPVFYY30 pKa = 11.04ALFTLVKK37 pKa = 10.24IPVTSGWKK45 pKa = 9.78SMANIFLAQPCAWRR59 pKa = 11.84VVSLQVLGCGKK70 pKa = 8.36TSYY73 pKa = 10.68RR74 pKa = 11.84KK75 pKa = 8.56GVVMAGHH82 pKa = 7.16RR83 pKa = 11.84EE84 pKa = 3.88PVSWRR89 pKa = 11.84EE90 pKa = 3.74QLRR93 pKa = 11.84ASLKK97 pKa = 8.93QTADD101 pKa = 3.27PDD103 pKa = 3.33ATIRR107 pKa = 11.84FGVGMGVLFFVLNSFRR123 pKa = 11.84DD124 pKa = 3.78EE125 pKa = 4.2VGLVLNLGLSLSLVAVFGIYY145 pKa = 10.45GLAARR150 pKa = 11.84NPGGRR155 pKa = 11.84PRR157 pKa = 11.84YY158 pKa = 9.15VRR160 pKa = 11.84GVVAAAVLIGVLAAALALVGQFFF183 pKa = 3.95
Molecular weight: 20.01 kDa
Isoelectric point according different methods:
Peptides (in silico digests for buttom-up proteomics)
Below you can find in silico digests of the whole proteome with Trypsin, Chymotrypsin, Trypsin+LysC, LysN, ArgC proteases suitable for different mass spec machines.| Try ESI |
 |
|---|
| ChTry ESI |
|
|---|
| ArgC ESI |
|
|---|
| LysN ESI |
|
|---|
| TryLysC ESI |
|
|---|
| Try MALDI |
|
|---|
| ChTry MALDI |
|
|---|
| ArgC MALDI |
|
|---|
| LysN MALDI |
|
|---|
| TryLysC MALDI |
|
|---|
| Try LTQ |
|
|---|
| ChTry LTQ |
|
|---|
| ArgC LTQ |
|
|---|
| LysN LTQ |
|
|---|
| TryLysC LTQ |
|
|---|
| Try MSlow |
|
|---|
| ChTry MSlow |
|
|---|
| ArgC MSlow |
|
|---|
| LysN MSlow |
|
|---|
| TryLysC MSlow |
|
|---|
| Try MShigh |
|
|---|
| ChTry MShigh |
|
|---|
| ArgC MShigh |
|
|---|
| LysN MShigh |
|
|---|
| TryLysC MShigh |
|
|---|
General Statistics
Number of major isoforms |
Number of additional isoforms |
Number of all proteins |
Number of amino acids |
Min. Seq. Length |
Max. Seq. Length |
Avg. Seq. Length |
Avg. Mol. Weight |
|---|---|---|---|---|---|---|---|
0 |
655671 |
40 |
4411 |
327.5 |
35.36 |
Amino acid frequency
Ala |
Cys |
Asp |
Glu |
Phe |
Gly |
His |
Ile |
Lys |
Leu |
|---|---|---|---|---|---|---|---|---|---|
12.056 ± 0.076 | 0.868 ± 0.017 |
6.186 ± 0.047 | 5.839 ± 0.053 |
3.297 ± 0.032 | 8.265 ± 0.049 |
2.335 ± 0.036 | 5.106 ± 0.041 |
3.457 ± 0.052 | 9.28 ± 0.068 |
Met |
Asn |
Gln |
Pro |
Arg |
Ser |
Thr |
Val |
Trp |
Tyr |
|---|---|---|---|---|---|---|---|---|---|
2.255 ± 0.024 | 2.964 ± 0.042 |
5.229 ± 0.045 | 3.452 ± 0.031 |
5.776 ± 0.061 | 5.436 ± 0.035 |
6.473 ± 0.068 | 8.229 ± 0.058 |
1.279 ± 0.02 | 2.219 ± 0.027 |
Most of the basic statistics you can see at this page can be downloaded from this CSV file
See this proteome in:

Proteome-pI is available under Creative Commons Attribution-NoDerivs license, for more details see here
| Reference: Kozlowski LP. Proteome-pI 2.0: Proteome Isoelectric Point Database Update. Nucleic Acids Res. 2021, doi: 10.1093/nar/gkab944 | Contact: Lukasz P. Kozlowski |