Klebsiella phage Pylas
Taxonomy: Viruses; Duplodnaviria; Heunggongvirae; Uroviricota; Caudoviricetes; Caudovirales; Schitoviridae; Humphriesvirinae; Pylasvirus; Klebsiella virus Pylas
Average proteome isoelectric point is 6.3
Get precalculated fractions of proteins
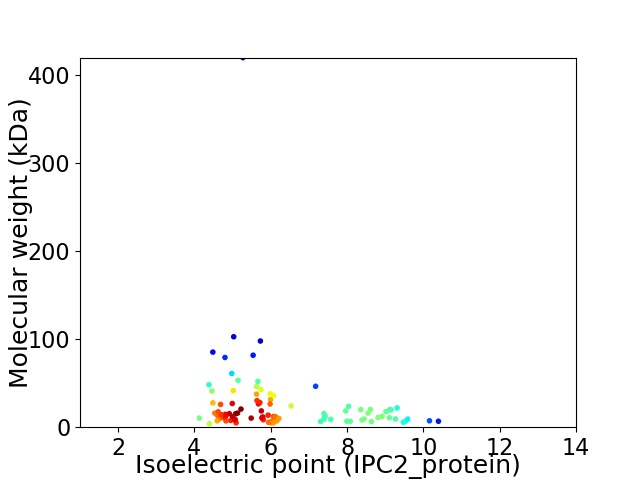
Virtual 2D-PAGE plot for 92 proteins (isoelectric point calculated using IPC2_protein)
Get csv file with sequences according to given criteria:
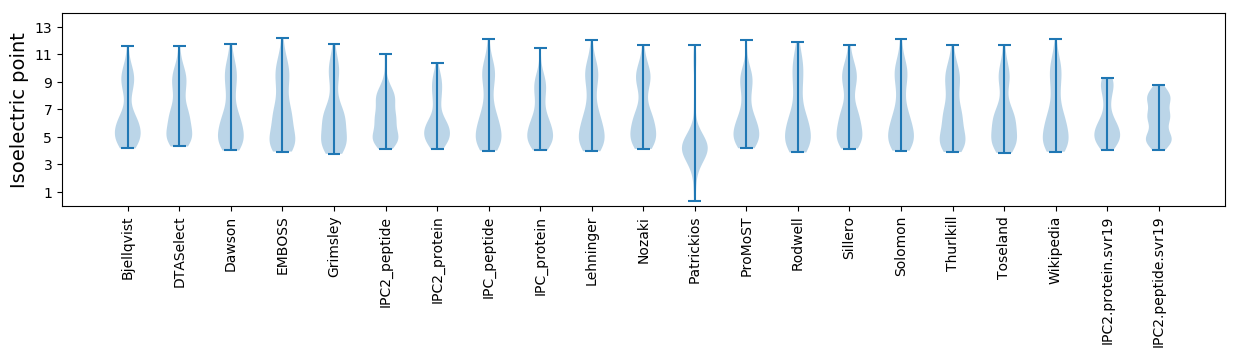
* You can choose from 21 different methods for calculating isoelectric point
Summary statistics related to proteome-wise predictions
Protein with the lowest isoelectric point:
>tr|A0A3G3BYH2|A0A3G3BYH2_9CAUD Uncharacterized protein OS=Klebsiella phage Pylas OX=2419682 GN=Pylas_011 PE=4 SV=1
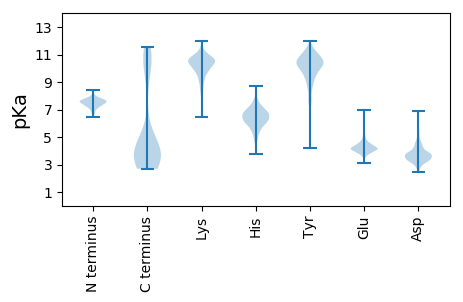
MM1 pKa = 7.9DD2 pKa = 3.24IWYY5 pKa = 8.6TEE7 pKa = 4.48LFWSLIGAIVGGITVYY23 pKa = 10.83LAIKK27 pKa = 10.36YY28 pKa = 10.15GDD30 pKa = 3.48NHH32 pKa = 6.85DD33 pKa = 3.74AA34 pKa = 4.59
MM1 pKa = 7.9DD2 pKa = 3.24IWYY5 pKa = 8.6TEE7 pKa = 4.48LFWSLIGAIVGGITVYY23 pKa = 10.83LAIKK27 pKa = 10.36YY28 pKa = 10.15GDD30 pKa = 3.48NHH32 pKa = 6.85DD33 pKa = 3.74AA34 pKa = 4.59
Molecular weight: 3.85 kDa
Isoelectric point according different methods:
Protein with the highest isoelectric point:
>tr|A0A3G3BZ85|A0A3G3BZ85_9CAUD Uncharacterized protein OS=Klebsiella phage Pylas OX=2419682 GN=Pylas_017 PE=4 SV=1
MM1 pKa = 6.91MRR3 pKa = 11.84KK4 pKa = 9.27SLIQGTKK11 pKa = 10.32ADD13 pKa = 3.63VARR16 pKa = 11.84MKK18 pKa = 10.54KK19 pKa = 9.87RR20 pKa = 11.84EE21 pKa = 4.04LAKK24 pKa = 9.57QTTRR28 pKa = 11.84SDD30 pKa = 2.84NCAPRR35 pKa = 11.84RR36 pKa = 11.84IVTFNHH42 pKa = 6.27PCIQEE47 pKa = 3.93VSS49 pKa = 3.35
MM1 pKa = 6.91MRR3 pKa = 11.84KK4 pKa = 9.27SLIQGTKK11 pKa = 10.32ADD13 pKa = 3.63VARR16 pKa = 11.84MKK18 pKa = 10.54KK19 pKa = 9.87RR20 pKa = 11.84EE21 pKa = 4.04LAKK24 pKa = 9.57QTTRR28 pKa = 11.84SDD30 pKa = 2.84NCAPRR35 pKa = 11.84RR36 pKa = 11.84IVTFNHH42 pKa = 6.27PCIQEE47 pKa = 3.93VSS49 pKa = 3.35
Molecular weight: 5.65 kDa
Isoelectric point according different methods:
Peptides (in silico digests for buttom-up proteomics)
Below you can find in silico digests of the whole proteome with Trypsin, Chymotrypsin, Trypsin+LysC, LysN, ArgC proteases suitable for different mass spec machines.| Try ESI |
 |
|---|
| ChTry ESI |
|
|---|
| ArgC ESI |
|
|---|
| LysN ESI |
|
|---|
| TryLysC ESI |
|
|---|
| Try MALDI |
|
|---|
| ChTry MALDI |
|
|---|
| ArgC MALDI |
|
|---|
| LysN MALDI |
|
|---|
| TryLysC MALDI |
|
|---|
| Try LTQ |
|
|---|
| ChTry LTQ |
|
|---|
| ArgC LTQ |
|
|---|
| LysN LTQ |
|
|---|
| TryLysC LTQ |
|
|---|
| Try MSlow |
|
|---|
| ChTry MSlow |
|
|---|
| ArgC MSlow |
|
|---|
| LysN MSlow |
|
|---|
| TryLysC MSlow |
|
|---|
| Try MShigh |
|
|---|
| ChTry MShigh |
|
|---|
| ArgC MShigh |
|
|---|
| LysN MShigh |
|
|---|
| TryLysC MShigh |
|
|---|
General Statistics
Number of major isoforms |
Number of additional isoforms |
Number of all proteins |
Number of amino acids |
Min. Seq. Length |
Max. Seq. Length |
Avg. Seq. Length |
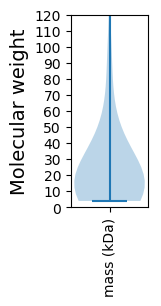
Avg. Mol. Weight |
|---|---|---|---|---|---|---|---|
0 |
21581 |
34 |
3819 |
234.6 |
26.25 |
Amino acid frequency
Ala |
Cys |
Asp |
Glu |
Phe |
Gly |
His |
Ile |
Lys |
Leu |
|---|---|---|---|---|---|---|---|---|---|
8.016 ± 0.398 | 1.075 ± 0.209 |
5.982 ± 0.207 | 6.547 ± 0.26 |
3.684 ± 0.173 | 6.288 ± 0.187 |
1.701 ± 0.168 | 6.478 ± 0.204 |
6.487 ± 0.308 | 8.646 ± 0.247 |
Met |
Asn |
Gln |
Pro |
Arg |
Ser |
Thr |
Val |
Trp |
Tyr |
|---|---|---|---|---|---|---|---|---|---|
2.808 ± 0.156 | 5.56 ± 0.253 |
3.911 ± 0.145 | 4.652 ± 0.338 |
4.402 ± 0.164 | 6.098 ± 0.21 |
6.158 ± 0.293 | 6.71 ± 0.246 |
1.056 ± 0.12 | 3.739 ± 0.229 |
Most of the basic statistics you can see at this page can be downloaded from this CSV file
See this proteome in:

Proteome-pI is available under Creative Commons Attribution-NoDerivs license, for more details see here
| Reference: Kozlowski LP. Proteome-pI 2.0: Proteome Isoelectric Point Database Update. Nucleic Acids Res. 2021, doi: 10.1093/nar/gkab944 | Contact: Lukasz P. Kozlowski |